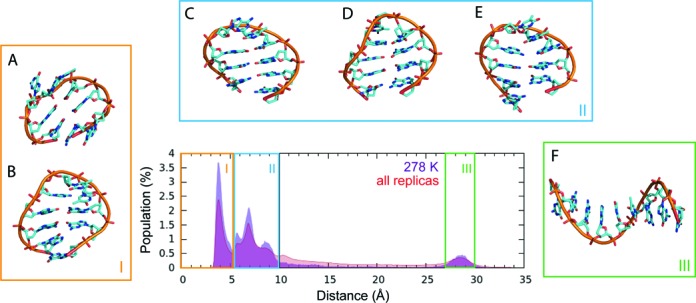
Figure 6.

T-REMD simulation of d[GGGTTAGGG]. The population of end-to-end distance represented by a distance between centres of masses of terminal guanine bases in the reference 278 K replica and in all 64 replicas. The region I with end-to-end distance bellow 5 Å corresponds to structures with stacked terminal guanines, region II includes native conformation with terminal GG base pair as well as the other bent conformations with strand slippage, and region III corresponds to the straight ssDNA. (A) circular structure containing G3-G9 and T4-G8 base pairs and stacked terminal guanines; (B) hairpin containing G2-G8 and G3-G7 base pairs and stacked terminal guanines; (C) hairpin with G2-G9, G3-G8 and T4-G7 base pairs; (D) hairpin with G1-G9, G2-G8 and G3-G7 base pairs; (E) hairpin with G1-G8, G2-G7 and G3-A6 base pairs; (F) unfolded ss-helix structure.
