
Figure 7.
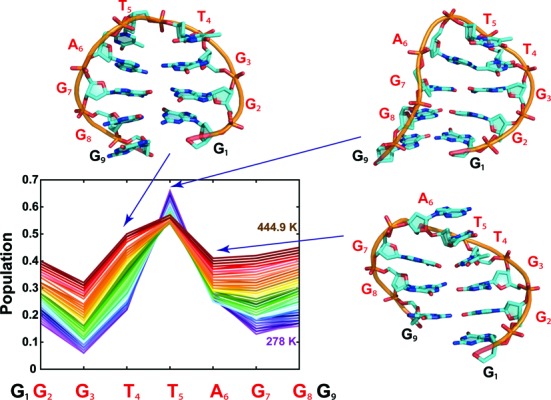
The bending propensity at different nucleotides along the d[GGGTTAGGG] sequence observed in the T-REMD simulation. The bent state was defined by N-1(C1′)…N(C1′)…N + 1(C1′) angle below 120° (see Supporting Information for further details). The lines correspond to replicas following temperature and are coloured according to the growing temperature from violet to maroon. The y-axis represents the population of the bend located at a particular nucleotide (x-axis) averaged over the entire replica. The representative structures taken from the T-REMD simulation correspond to the most populated bent conformations.