Figure 2.

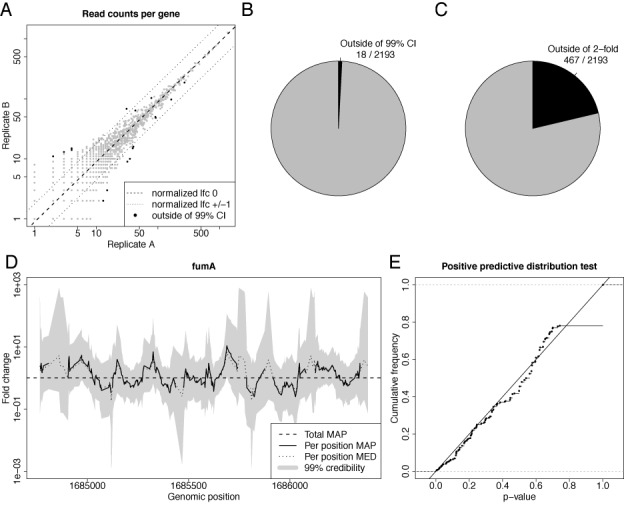
Credible intervals for random barcode RNA-seq data. (A) A scatter plot of the fragment counts from two replicate RNA-seq experiments for each gene is shown. The dashed line corresponds to a log2 fold change (lfc) of 0, the dotted lines to a lfc of 1 and −1. Black dots correspond to genes where the normalization constant is outside of the 99% fold change credible interval. (B,C) The number of not credible genes and genes deviating more than 2-fold are illustrated; i.e. the number of black dots and dots outside of the dotted lines in Figure 2A, respectively. (D) The MAP fold changes of the local fragment coverage of fumA, their 99% credible intervals as well as the median of the posterior distribution (MED). The horizontal line corresponds to the estimated total fold change of fumA (total MAP). At several positions, the MAP is undefined due to zero coverage in one of the replicates. (E) The distribution of P-values computed by the posterior predictive function is shown for all positions in D. It is essentially a uniform distribution, i.e. the local fold changes indeed are distributed according to the beta binomial distribution, as predicted by our model.
