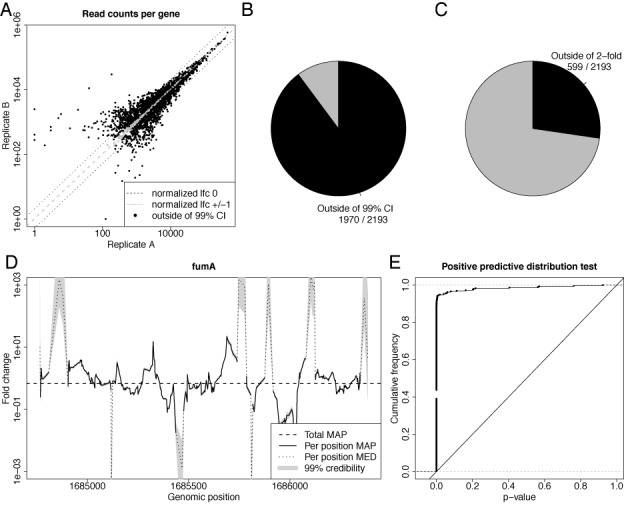
Figure 4.

Credible intervals for RNA-seq data. The same plots are shown as in Figure 2, but with reads instead of fragments, i.e. the random barcodes have not been used to infer fragment counts. Thus, this figure and its differences to Figure 2 illustrate the expected results for an RNA-seq without random barcodes. Due to PCR amplification, read counts are artificially inflated, resulting in grossly underestimated sampling noise. See main text for a discussion.
