Figure 5.

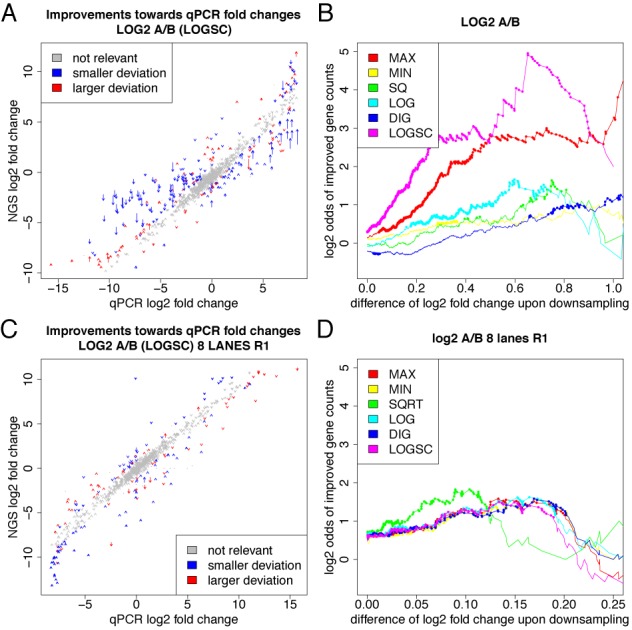
Validation of downsampling. (A/C) qPCR measurements from the MAQC/SEQC project are scattered against corresponding the mRNA-seq derived fold changes (A) for the older data set (26) and (B) for the more recent data set (C). Arrows are drawn for each gene indicating the fold changes before (arrow start) and after (arrow tip) downsampling by LOGSC. Improved fold changes are indicated in blue, worse fold changes in red. Fold changes whose deviation is smaller than two-fold with and without correction are indicated in gray. (B/D) Results are summarized for all procedures. The x-axis corresponds to the absolute difference of log2 fold change upon downsampling, i.e. to the length of an arrow in (A) and (C). Plotted is the log ratio comparing the number of genes that are improved to the number of genes that are made worse by downsampling for a minimal value of absolute difference. Dots correspond to statistically significant odds ratios according to a binomial test (p < 0.01). In (B) especially for LOGSC and MAX, there are significantly more genes where downsampling leads to smaller deviations from the gold-standard than genes with larger deviation. In (D), differences between the downsampling approaches are less pronounced and odds are more modest (but still significantly in favor of improved fold changes).
