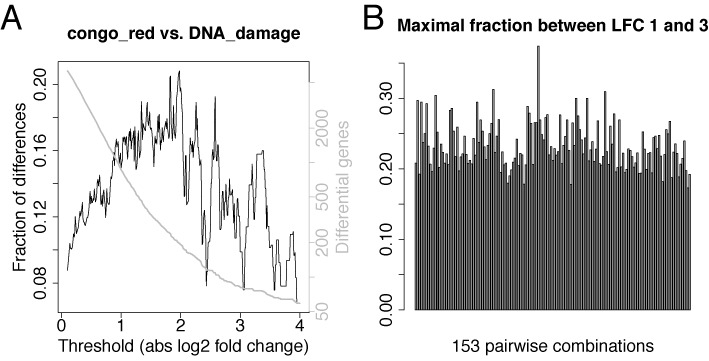
Figure 6.

Affected genes in a typical RNA-seq experiment. (A) In (29), the yeast transcriptome was analyzed using RNA-seq under 18 environmental conditions and here, results are shown for one possible comparison (congo red vs. DNA damage). The x-axis corresponds to absolute log2 fold change thresholds. The y-axis shows which fraction of all genes that are above the threshold before or after correction are not above the threshold in both cases (black) and, how many genes are called differential before or after correction (gray). (B) The maximal fractions of different calls for log fold change thresholds between 1 and 3 is summarized for all 153 pairwise combinations of these 18 conditions.
