
Figure 8.
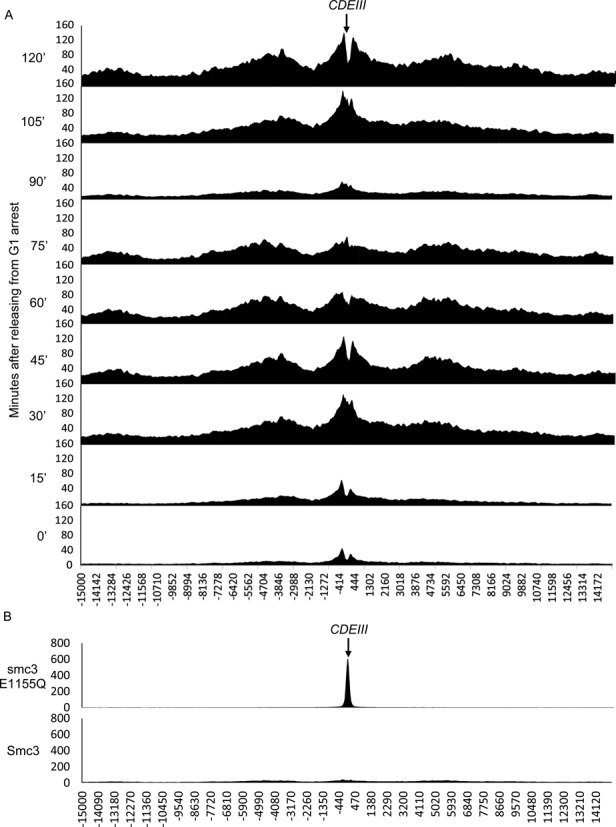
Cohesin dynamics around the centromere. The number of reads per base pair (Y-axis) in the 15kb regions either side of the CDEIII element for each chromosome (X-axis) were averaged and calibrated to reveal the average cohesin distribution around the centromere. (A) The profiles of the average cohesin distribution throughout the cell cycle from the data in Figure 3. (B) The average cohesin distribution in cycling Smc3 E1155Q ATP hydrolysis mutant cells compared to WT cells.