
Figure 9.
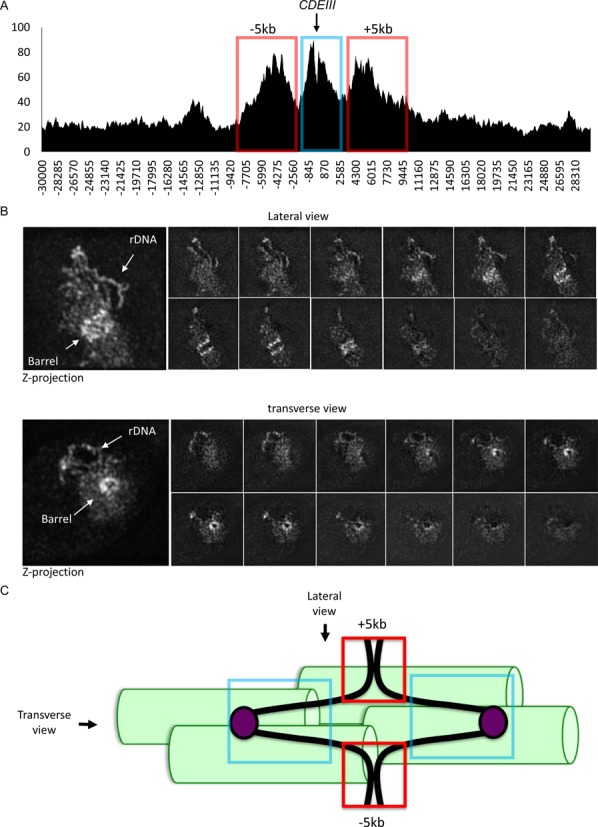
Pericentric cohesin viewed by calibrated ChIP-seq and cell images. (A) Cohesin's peri-centric distribution in G2/M phase cells. The number of reads per base pair (Y-axis) in the 30 kb regions either side of the CDEIII element for each chromosome (X-axis) were averaged and calibrated to reveal the average cohesin distribution around the centromere. The data was extracted from ChIP-seq of cells at 60 min. after released from G1-arrest in Figure 5. The ‘5 kb’ peaks are marked by red boxes and centromere-proximal cohesin marked by blue box. (B) High-resolution image of cohesin in G2/M phase. Tetraploid cells containing 64 chromosomes with endogenous Scc1 tagged with EGFP (K18719) were exponentially grown in YPD at 25°C and fixed with 2% of formaldehyde. The cells were observed under high-resolution OMX microscope. The lateral view is shown on the top panel and the transverse view on the bottom one. (C) Bi-orientation of sister kinetochores and peri-centric cohesion mediated by ‘5 kb’ peaks (red boxes) in G2/M phase cells. Sixty-four such bi-oriented chromosomes will be clustered around pole to pole microtubules, generating the cohesin barrels shown in (B). Chromosome axes – the black fibre. Kinetochores – mauve balls. Centromere-proximal cohesin - blue box. Pole to pole microtubules – green cylinders.