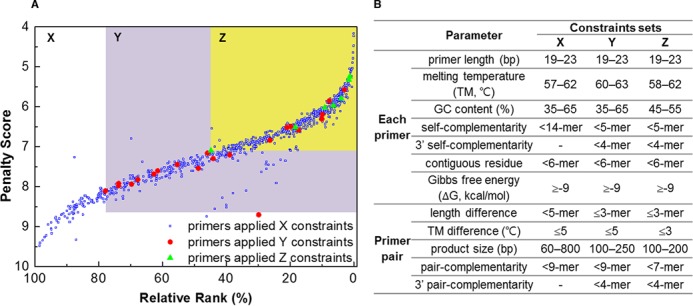
Figure 2.

The advantage of the ranking method of MRPrimer. Primer pairs following strict constraints have high ranks and viceversa. The top-1 primer pair of MRPrimer indicates that it follows the strictest constraints for the target sequence. (A) Distribution plot of 772 primer pairs specifically covering mouse OR genes; these primer pairs are common to PrimerBank and MRPrimer. They are sorted by the ranking method of MRPrimer, in particular by relative rank along the horizontal axis and by penalty scores ranked along the vertical axis. The 737 blue dots are spread over the area of X (i.e. the entire area), the 28 red dots are spread over the area of Y and the 7 green dots are spread over the area of Z (i.e. yellow colored area). (B) The sets of filtering constraints corresponding to each area.
