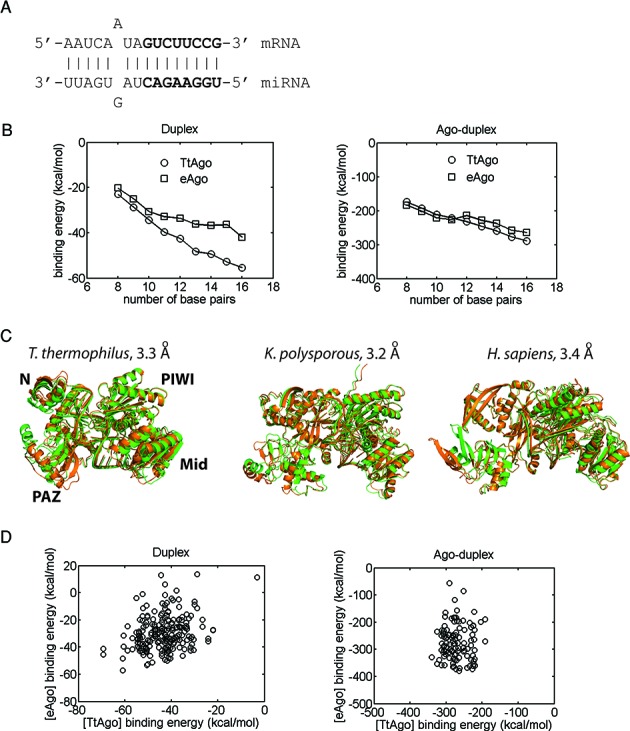
Figure 3.

Comparison of the binding affinity trends and dynamics for various bacterial and eukaryotic Ago–RNA complexes. (A) Secondary structure of the full duplex in complexes; seed region in bold letters. (B) Duplex binding affinities (left) and Ago-duplex binding affinities with no entropic contributions (right) of bacterial (T. thermophilus, TtAgo) and eukaryotic (eAgo, averaged K. polysporous (Kp) and human) miRISCs as a function of the duplex length or the number of base pairs. Shorter duplexes were derived from the full duplex by truncation from the 3′ end of the miRNA. Each data point represents an average for 10 complexes with different low-energy duplex conformations. (C) Comparison of the dynamics (mode 1) of Tt, Kp, and human miRISCs with the full duplex. Superimposed structures of the two end points of motion are shown (RMSD values indicated). (D) Scatterplots of bacterial (TtAgo) and eukaryotic (eAgo) miRISC binding affinities for 11 full duplexes, each differing by a single base-pair mismatch (with 10 constructed miRISCs per duplex): (left) duplex binding energies and (right) Ago-duplex binding energies with no entropic contributions within miRISCs.
