
Figure 5.
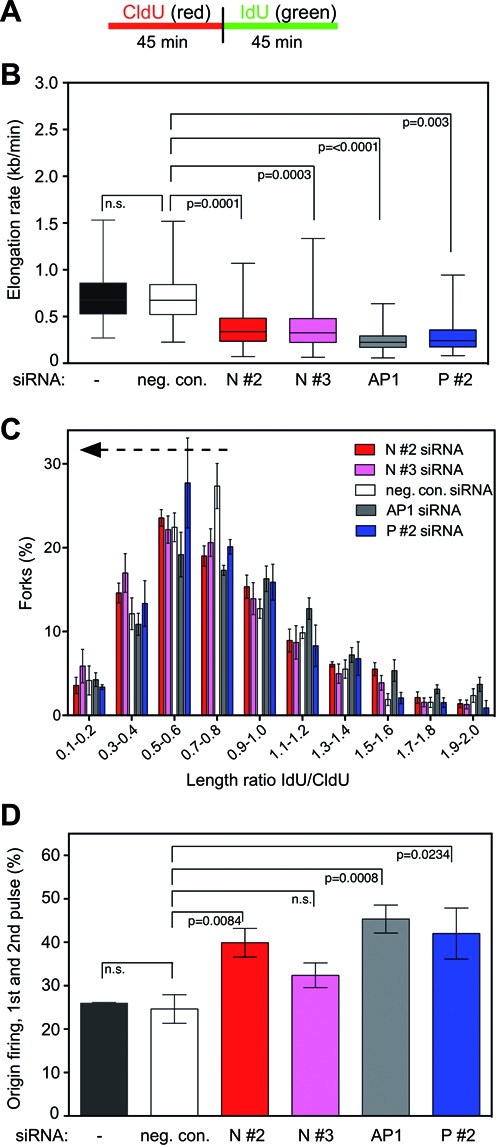
NUCKS1 is required for unperturbed and continuous DNA replication fork progression. (A) The labeling protocol used in this experiment. (B) Knockdown of NUCKS1 impairs DNA elongation rates under unperturbed conditions. U2OS cells were transfected with one of two different siRNAs targeting NUCKS1 (N #2, N #3), or with negative control (neg. con.), RAD51AP1 (AP1), or PALB2 siRNA (P #2) for comparison purposes. Untransfected cells (-) were also assessed. In box plots, boxes encompass the 25th–75th percentile, with error bars defining the minima and maxima. The black horizontal bars within the boxes indicate the means. The data are from seven independent experiments, except for P #2 siRNA the data for which are from 3 independent experiments. (C) Knockdown of NUCKS1 causes discontinuity in replication fork progression. U2OS cells were transfected as in (B), and elongation rates of red- (CldU) and green-labeled (IdU) fiber tracts were determined. The data show the distribution of IdU/CldU length ratios from 400 individual fibers of 7 (neg. con., N #2, N #3, AP1 siRNA) and 3 (P #2 siRNA) different experiments. Compared to control cells (neg. con. siRNA), IdU/CdU length ratios ≤ 0.84 are significantly shorter for N #2 (P = 0.0023), N #3 (P = <0.0001) and AP1 depletion (P = 0.0207), but not for P #2 depletion (P = 0.1553; one-tailed Mann Whitney U test). (D) Knockdown of NUCKS1 leads to elevated levels of first and second pulse replication origins under unperturbed conditions. U2OS cells were transfected as in (B) and first and second pulse replication origins were determined by quantification of green–red–red–green and green-only structures, respectively. The data are the means ± 1 SEM of 7 (neg. con., N #2, N #3, AP1 siRNA) and 3 (P #2 siRNA) independent experiments.