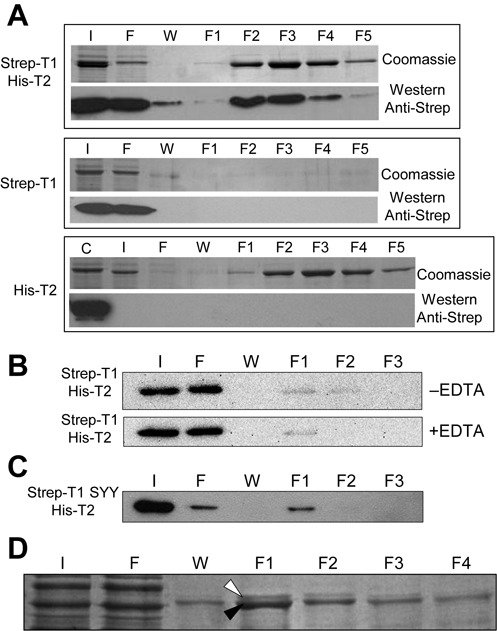
Figure 5.

T1 and T2 form heterodimers. (A) Extracts form E. coli expressing the proteins indicated at the left were subjected to Ni-NTA affinity chromatography, and fractions were resolved by SDS-PAGE and stained with coomassie or transferred to membranes and incubated with anti-StrepTag-II antibodies, as indicated at the right. Letters ‘I, F, W and F1-F5′ indicated respectively input, flow through, wash and elution fractions 1–5. Letter ‘C’ on top of the bottom panel indicate a positive control for the western. (B) Panels show western blots with anti StrepTag-II antibodies. Labels and details are like in (A) but the chromatography was performed in the presence or absence of 5 mM EDTA (as indicated on the right) and the washing step was increased to 20 column volumes. (C) Labels and details are like in (A). (D) Extracts were prepared from Anabaena cells expressing Strep-T2 and purified through streptavidine columns. White and black arrowpoints indicate respectively T1 and Strep-T2 proteins.
