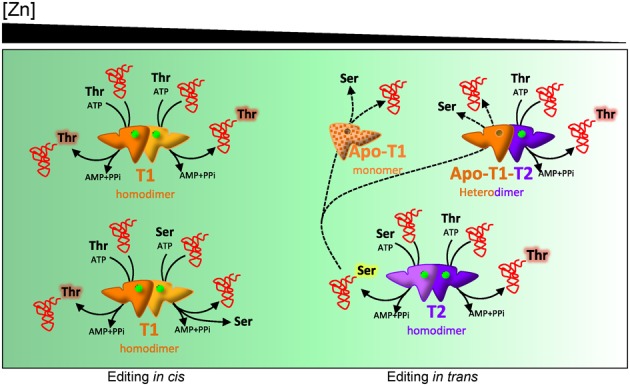
Figure 6.

Model for the concerted action of T1 and T2. The diagram represents distinct states of the cell according to zinc availability as indicated on top of the panel. T1 is depicted in yellow-orange and T2 in purple-magenta. Green dots represent zinc atoms. Amino acids bound to the tRNA are highlighted. The apo-T1 monomer is colored with a dotted pattern to indicate that it may exist transiently upon dissociation of dimeric T1.
