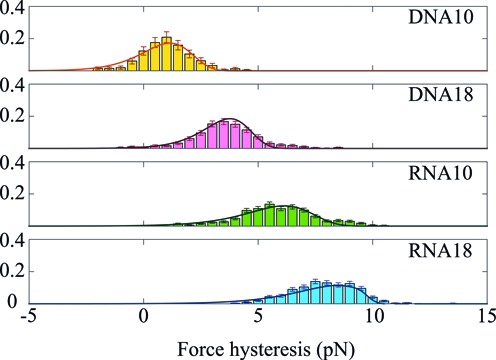
Figure 6.

Histograms of the hysteresis measured at 150 nm/s on the four different hairpins. The experimental distributions are fitted to calculated convolution of the unfolding and folding probability distributions (solid line), as explained in Materials and Methods and Supplementary Section S1 (Equations (4–6)). For each fitted histogram, the root mean squared error (rmse) is in the range (2.0–3.0) × 10−3. For DNA10 the data come from 46 stretch/release cycles on 12 molecules. DNA18: 95 cycles on 13 molecules. RNA10: 152 cycles on 44 molecules. RNA18: 150 cycles on 21 molecules.
