Figure 8.

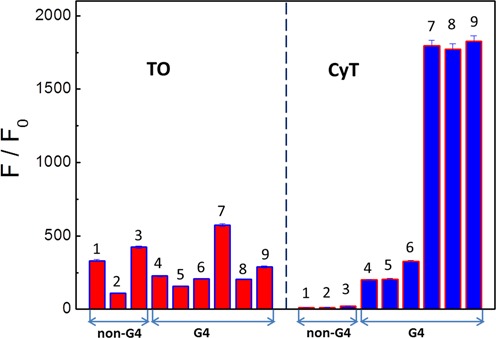
Dependence of TO and CyT fluorescence intensity at 595 nm on G4 and nonG4 sequences: (i) HP-18, (ii) ssAf17, (iii) tRNA, (iv) tRNA-Ala fragment, (iv) tRNA-Cys fragment, (vi) Spinach (vii) Bulges-TB1, (viii) VEGF and (ix) Tel22.

Dependence of TO and CyT fluorescence intensity at 595 nm on G4 and nonG4 sequences: (i) HP-18, (ii) ssAf17, (iii) tRNA, (iv) tRNA-Ala fragment, (iv) tRNA-Cys fragment, (vi) Spinach (vii) Bulges-TB1, (viii) VEGF and (ix) Tel22.