
Figure 2.
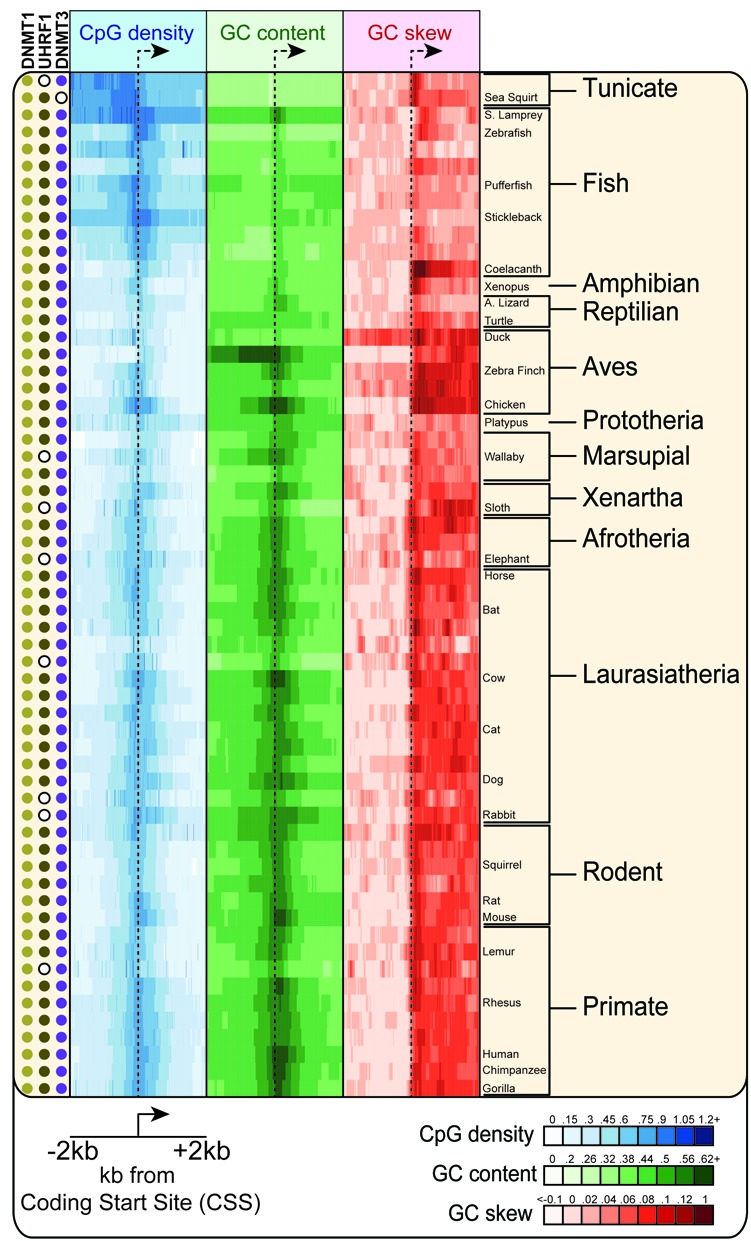
Conservation of CpG density, GC content and GC skew across chordates. A stretch of ±2 kb centered around the CSS of core genes was analyzed for CpG density, GC content, and GC skew over tiled overlapping windows. For each species, the value of each sequence metric measured over all core genes is depicted using a color scheme (see inset); each tick mark corresponds to one 200 bp window. Relevant taxonomic groups and species are indicated on the right. In each species, the presence of orthologs for the DNA methylation machinery is indicated by a colored dot. Absence of an ortholog is indicated by a white circle with a black outline.