
Figure 4.
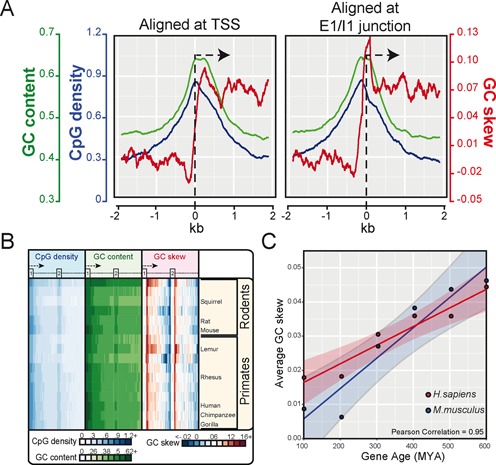
GC skew is maximal over the exon 1/ intron 1 junction. (A) GC skew, together with CpG density and GC content, is plotted over a ±2 kb window for core human genes aligned at their TSSs (left) or at the E1/I1 junction (right; single exon genes were excluded). (B) Heatmaps depicting CpG density, GC content and GC skew for all genes in primates and rodents. The data is shown as a percentile plot in which genes were aligned at the start of exon 1 and the first two exons and introns, when present, were normalized in size. A stripe of positive GC skew is observed immediately downstream of the E1/I1 junction. (C) Scatterplot depicting the strength of GC skew over the first 750 bp downstream of TSS as a function of gene age in human (red dots) and mouse (blue dots). Genes were binned by 100 million year intervals; the linear regression line is indicated together with the 95% confidence interval (shaded).