
Figure 6.
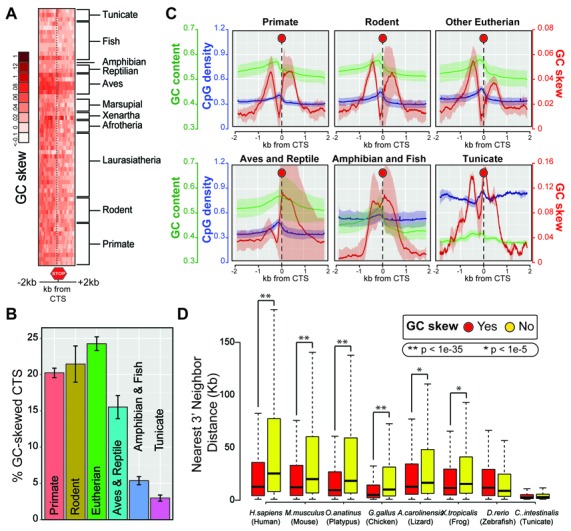
Terminal GC skew is a conserved feature of a subset of closely arranged genes in chordates. (A) Patterns of GC skew in a 2 kb window surrounding the coding termination site (CTS) of core genes are shown as a heatmap. Chordates do not show distinctive patterns of GC skew around the CTS. (B) For each group of organisms, the frequency of terminal GC skew as annotated by our new SkewR algorithm is indicated as a percentile boxplot (with standard deviation). Only a subset of genes carries terminal GC skew. (C) Metaplots depicting the position and amplitude of GC skew, GC content, and CpG density shifts around the CTS in various chordate subgroups. Representations are as in Figure 3B. (D) Genes with strong terminal GC skew tend to be more closely arranged than non-skewed genes in a subset of species. The boxplot shows the mean inter-gene distance between GC-skewed genes and non-skewed genes. Statistical significance as determined by a Wilcoxon rank-sum test is indicated above.