
Figure 2.
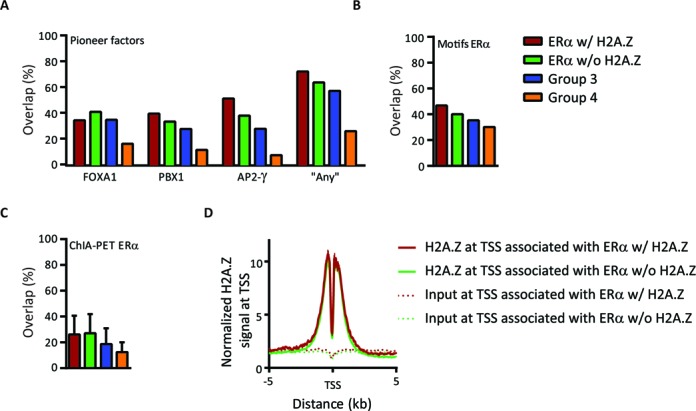
Characterization of ERα groups (A–C). The overlap proportion between ERα groups and pioneer factors enriched regions (A), the ERE motifs (B), or the ERα engaged in long-range chromatin interactions (C). ‘Any’ represents at least one of the FOXA1, PBX1 or AP2-γ-binding sites (47,48). The mean ± SEM of two replicates of ChIA-PET data of ERα are represented. (D) The average profiles of H2A.Z normalized signal over the TSS associated with ERα w/ and w/o H2A.Z.