
Figure 6.
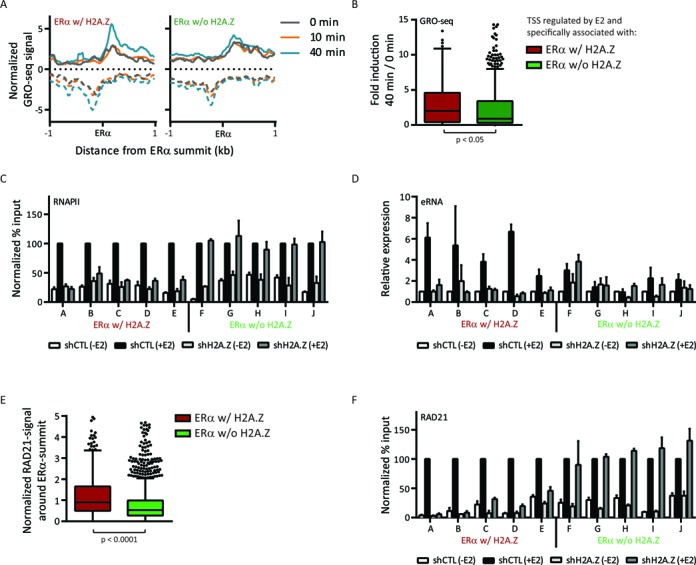
H2A.Z helps the recruitment of RNA polymerase II and cohesin complex as well as transcription at active enhancers. (A) Average profiles of strand-specific GRO-seq signal over intergenic ERα-active enhancers at 0 (grey), 10 (orange) and 40 (blue) min after E2 stimulation. (B) Distribution of the changes in the expression of E2-regulated genes, specifically associated with ERα w/ or w/o H2A.Z (considered to be their direct E2-regulated target genes, common targets were discarded from this analysis), following a 40 min of E2 stimulation. The transcription of the E2-regulated genes specifically associated with ERα w/ H2A.Z is more induced following E2 stimulation (P-value < 0.05, Mann-Whitney test). (C) ChIP-qPCR of RNAPII (8WG16 antibody) before and after E2 stimulation (30 min) and with or without H2A.Z depletion by shRNA. Five loci of both ERα w/ H2A.Z (loci (A) to (E)) and ERα w/o H2A.Z (loci (F) to (J)) were studied. The results are normalized to shCTL +E2 and represent the mean ± SEM of two independent biological replicates. The coordinates of each locus as well as the sequences of the primers are available in the Supplementary Table 3. (D) RT-qPCR analyses using the same conditions and primers than panel (C). The expression levels are relative to the expression of RPLP0 and are normalized to shCTL -E2. The results represent the mean ± SEM of four independent biological replicates. (E) Normalized RAD21 signal distribution at intergenic ERα-active enhancers in the presence of E2. The signal of RAD21 is significantly higher in ERα w/ H2A.Z (P-value < 0.0001, Mann-Whitney test). (F) Same analysis as (C), but using RAD21 antibody.