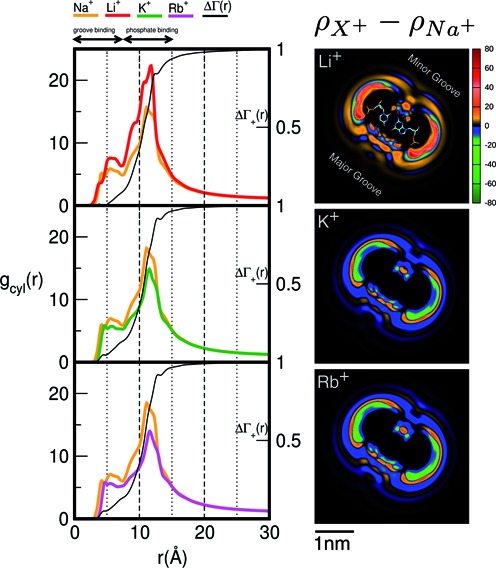
Figure 4.

The effect of cation size on spatial distribution functions. (Left) Cylindrical radial distribution functions of cations from 3D-RISM calculations where both the background (Na+) and competing (Li+, K+ and Rb+) cation have the same bulk concentration (50 mM). The normalized running integral of the difference between the background and competing cation densities, (Equation 8), is shown in black and its corresponding scale is shown on the right. The most competitive cations bring an excess of density located mainly in the vicinity of the DNA, particularly in the region of the phosphate binding, whereas for radii greater than ∼15 Å the densities of both cations are the same. (Right) Difference between 2D-untwisted ion densities (
 ) where X+ = Li+, K+ and Rb+. Untwisted densities for each cation are presented in Supplementary Figure S6.
