
Figure 3.
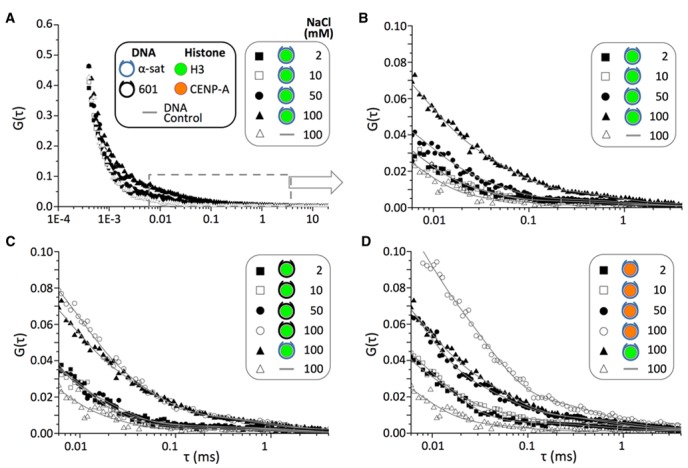
Fluorescence correlation spectra of the three nucleosomes reveal differences in DNA termini dynamics that are histone and salt-dependent. (A) FCS spectra of the ATTO647N photons from the H3-SAT nucleosome in a TE buffer at 2, 10, 50 and 100 mM NaCl. The DNA control (DNA-DA, Supplementary Figure S1 and Supplementary Table S6) spectrum at 100 mM NaCl is also added for comparison. The color-coded symbols for histones and DNA are applicable to all four panels. (B) The same spectra as shown in (a) magnified between 6 μs and 4 ms. A double exponential decay function (A1exp(−t/t1) + A2exp(−t/t2) + A0) was used to fit each FCS spectrum. (C) FCS spectra of the ATTO647N photons from the H3–601 nucleosome in a TE buffer at 2, 10, 50 and 100 mM NaCl. The H3-SAT and DNA-DA spectra at 100 mM are also shown for comparison. (D) FCS spectra of the ATTO647N photons from the CA-SAT nucleosome in a TE buffer at 2, 10, 50 and 100 mM NaCl. The H3-SAT and DNA-DA spectra at 100 mM are also added for comparison. The FCS spectra shown in (c) and (d) over the entire time range can be found in Supplementary Figure S4.