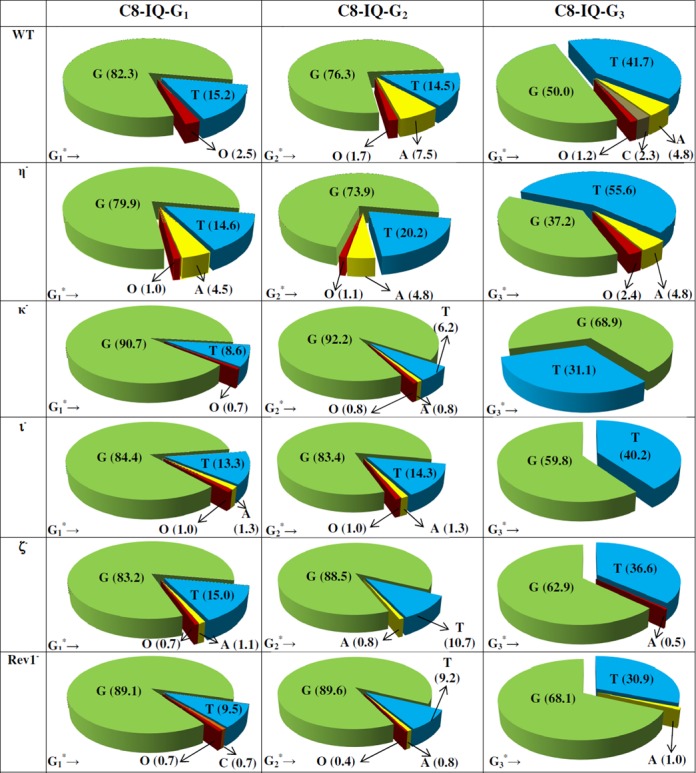
Figure 4.

The types and frequencies of mutations induced by dG-C8-IQ in the progeny from the G1, G2 and G3 constructs in HEK293T cells also transfected with NC siRNA (293T) or siRNA for single pol knockdowns are shown in a pie chart. O represents other mutations. The data represent the average of two independent experiments (presented in Supplementary Table S1 A–F in the SI).
