
Figure 1.
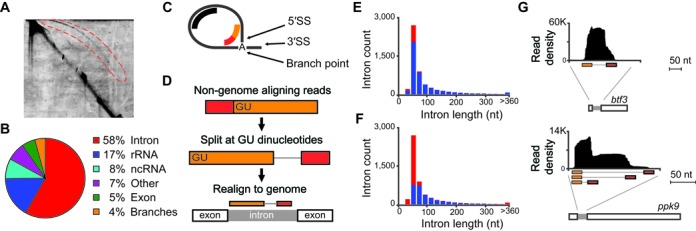
Intron lariat sequencing defines splicing patterns. (A) Image of two-dimensional gel electrophoresis of RNA isolated from Δdbr1 S. pombe. Intron lariats (red-bounded region) were isolated and used as source material for sequencing. (B) Pie-chart summarizing allocation of lariat sequencing reads to indicated genomic regions. (C) Illustration of intron lariat and splice sites, depicting intron-mapping reads (in black) and branch-spanning reads (in red-orange). (D) Schematic of alignment strategy for candidate branch-spanning reads, together with illustration of aligned branch-spanning read. (E) Histogram of annotated introns counts (y-axis) separated by length (x-axis, 20 nucleotide bins), indicating introns recovered with intron-mapping reads (blue) and those not recovered (red). (F) Histogram of annotated introns counts (y-axis) separated by length (x-axis, 20 nucleotide bins), indicating introns precisely recovered with branch-spanning reads (blue) and those not recovered (red). (G) Intron-mapping reads (y-axis indicates read density) aligning (x-axis indicates alignment position) to indicated S. pombe pre-mRNAs, together with branch-spanning reads (orange-red) aligned with split-read mapping strategy. The btf3 peak density truncated at +/-50 nt of intron boundaries. The ppk9 peak tapers just upstream of intron boundaries.