
Figure 6.
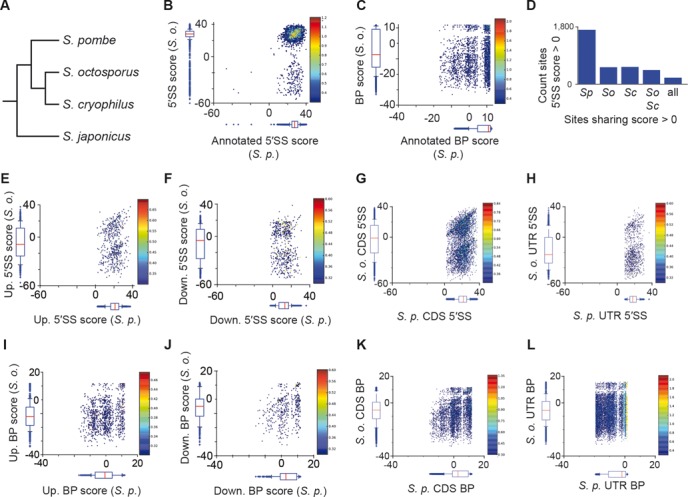
Comparative analyses of S. pombe splice sites. (A) Cladogram illustrating Schizosaccharomyces species included in subsequent analyses. (B) Heat map and boxplots indicating relationship and distributions of annotated 5′SSs in S. pombe (x-axis) and S. octosporus (y-axis). (C) Recovered annotated intron BP sequences, plotted as in (B). (D) Counts of alternative 5′SSs in S. pombe exceeding a score of zero, together with counts for sites conserved in indicated species. (E–H) Comparison of 5'SS between S. pombe and S. octosporus for: alternate upstream 5′SSs (E), alternate downstream 5'SS (F), control upstream 5′SSs (G) and control downstream 5'SSs (H); plotted as in (B). (I–L) Comparison of BPs between S. pombe and S. octosporus for: alternate upstream BPs (I), alternate downstream BPs (J), control upstream BPs (K) and control downstream BPs (L); plotted as in (B).