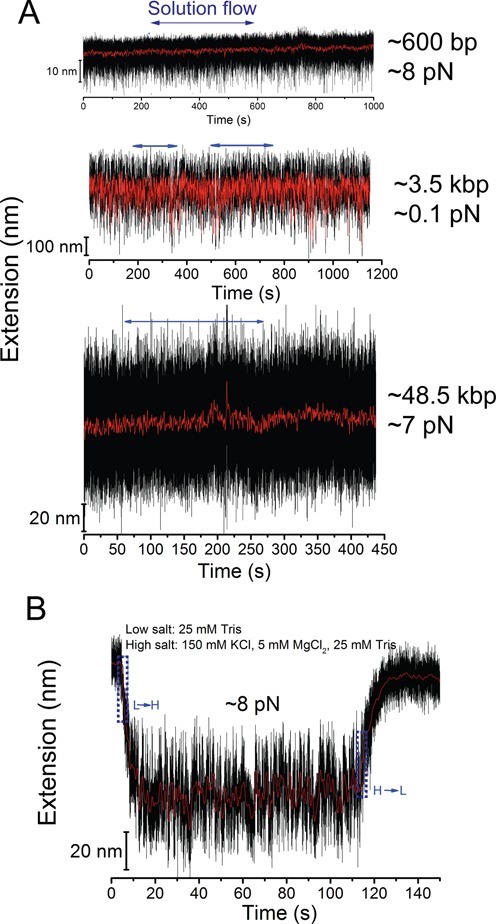
Figure 3.

Experimental test of the performance of the disturbance-elimination method. (A) Representative extension time traces of dsDNA molecules with three different contour lengths (top—576 bp; middle—∼3.5 kbp; bottom—∼48.5 kbp) at the bottom of a microwell (H: 100 μm; D: 40 μm) before, during and after introduction of a flow with speed of ∼10 cm/s. The horizontal blue arrows indicate the period of flow. The results show that the extension fluctuation is not affected by the flow. (B) Representative extension time traces of a 576 nt ssDNA switched between a low salt concentration (20 mM Tris without other salts) and a higher salt concentration (20 mM Tris with 100 mM NaCl and 5 mM MgCl2), which indicates a time scale of several seconds needed for complete solution exchange between fluids in the microwell and in the channel. The blue dash boxes indicate the periods of solution exchange.
