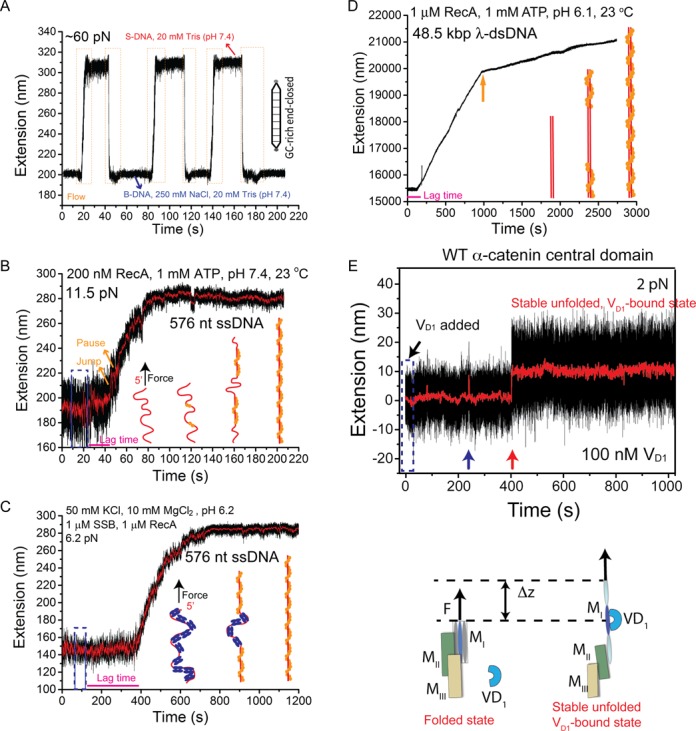
Figure 4.

Representative applications. (A) Interconversions of a ∼ 600 bp end-closed GC-rich dsDNA between the B-form and the overstretched S-form DNA structures induced by salt concentration change at a constant force of ∼ 60 pN. During cycles of switching between 250 mM and 0 mM NaCl in 20 mM Tris (pH 7.4), the DNA extension correspondingly switched between a shorter level (B-DNA) in 250 mM NaCl and a longer level (S-DNA) in 0 mM NaCl. The orange dash boxes indicate the time windows during rapid solution exchange. (B) A typical extension time trace of a 576 nt ssDNA before, during and after 200 nM RecA (with 1 mM ATP, 1x ATP regeneration system, 50 mM NaCl, 10 mM MgCl2, 20 mM Tris pH 7.4) was introduced at a constant force of ∼ 11 pN. (C) A typical extension time trace of a 576 nt SSB-coated ssDNA before, during and after solution containing 1 μM RecA and 1 μM SSB (with 1 mM ATP, 1x ATP regeneration system, 50 mM NaCl, 10 mM MgCl2, 20 mM MES pH 6.2) was introduced at a force of ∼ 6.5 pN. For B&C, schematics of the RecA polymerization process are shown in figure panels. (D) A representative extension time trace of a 48.5 kbp λ-DNA before, during and after 1 μM RecA (with 1 mM ATP, 1x ATP regeneration system, 50 mM NaCl, 10 mM MgCl2, 20 mM MES pH 6.1) was introduced at a constant force of ∼ 10 pN. The solution was introduced within 10 s at the beginning of the time trace. The spike at ∼ 240 s is due to transient diffusion of a polystyrene bead into the view area that affected the bead imaging. (E) A representative time trace of the extension of an α-catenin MI domain tether during and after rapid introduction of 100 nM vinculin D1 solution at a constant low force of ∼ 2 pN. The short-lived spikes in 0–400 s are transient unfolding of the α-catenin MI domain. A vinculin D1 molecule binds to transiently exposed α-catenin MI domain at ∼ 400 s, stabilizing it in the unfolded state, as illustrated in the bottom panel. Blue dash boxes in panels B–E indicate the flow periods.
