
Figure 4.
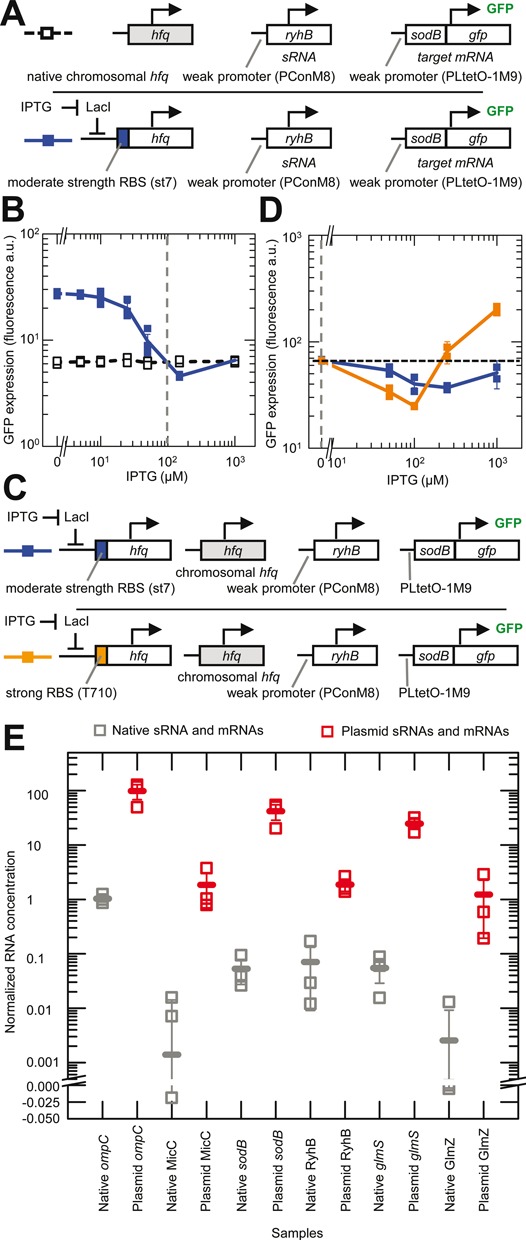
Comparison of physiological and induced concentrations of Hfq, sRNAs and mRNAs. Error bars are the SEM. (A) Schematic of the experimental system. sRNA activity with chromosomal (chr.) hfq was measured by its effect on the expression of the target mRNA (sodB::gfp). For comparison, Hfq production was increased from a plasmid copy of hfq under the control of PLlacO-1 in an hfq deletion strain until the same expression levels were achieved as with chromosomal hfq. The color of the boxes to the left indicate the corresponding data and line colors in panel B. Strains: HL6370 (plasmid hfq with st7 RBS) and HL6581 (chr. hfq). (B) Experimentally measured GFP expression (with constant transcription of target mRNA and sRNA) as a function of IPTG concentration for the systems shown in panel A. Connecting lines are guides to the eye that connect the mean GFP expression at each IPTG concentration. Vertical dash line indicates the IPTG concentration predicted to produce an induced level of Hfq that is equivalent to the level from chr. hfq (see main text). n = 21 for each strain with measurements in three replicate cultures at each concentration. (C) Schematic of the experimental system, which is the same as that shown in the lower row of panel A except that chr. hfq is present and the induced hfq either had a moderately strong RBS (st7) or a very strong RBS (T710). The color of the boxes to the left indicate the corresponding data and line colors in panel D. (D) Experimentally measured GFP expression from the target mRNA (with constant transcription of target mRNA and sRNA) as a function of IPTG concentration for the systems shown in panel C. Lines are guides to the eye that connect the mean GFP expression at each IPTG concentration. Horizontal dash line shows the starting level of GFP expression with only chromosomal hfq expressed and no induction from PLlacO-1. Note: GFP expression was measured on a different FACS machine to the experiments in panel B and therefore the absolute values cannot be directly compared. Vertical dash line indicates the concentration of Hfq from chr. hfq alone. n = 10 for each strain with measurements in duplicate at each concentration. Strains: HL6199 (chr. hfq + plasmid hfq with st7 RBS) and HL6200 (chr. hfq + plasmid hfq with T710 RBS). (E) Experimentally measured relative sRNA and mRNA concentrations in cells with endogenous genes on the chromosome (in HL716) and in cells with constitutive transcription of sRNAs and mRNAs from a plasmid (HL1178, HL2839, HL3373, HL3395, HL5963 and HL6257). The sRNA and mRNA concentrations are normalized to the 16S loading control. Each sRNA and mRNA was measured in three replicate cultures (each measurement is shown by an unfilled square). The mean value in each set of samples is indicated by a horizontal line. In these experiments all the plasmid mRNAs and sRNAs were transcribed from the PLlacO-1 promoter except GlmZ which was transcribed from the pConshort promoter.