Figure 5.

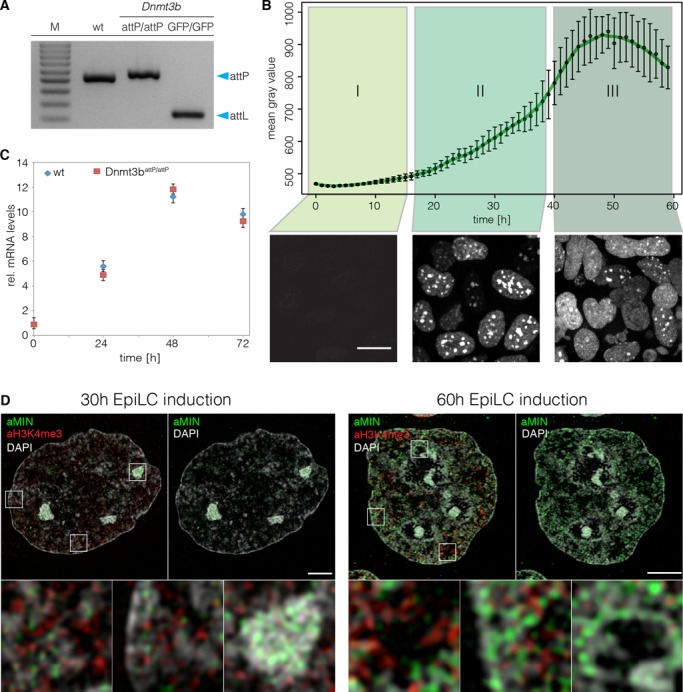
Spatio-temporal dynamics of DNMT3B during epiblast differentiation. (A) Gel electrophoresis of the multiplex screening PCR for wt, Dnmt3battP/attP and Dnmt3bGFP/GFP. Blue arrows indicate expected sizes of the non-recombined (attP) and recombined allele (attL). (B) Evaluation of GFP signals during live cell imaging of Dnmt3bGFP/GFP cells. The graph depicts mean gray values of nuclear GFP signals. Error bars represent standard deviations (n > 81). Lower panels show Z-projections of Dnmt3bGFP/GFP cells representative of the indicated time frame. Scale bar represents 10 μm. (C) Quantitative real-time PCR of Dnmt3b mRNA levels in wt and Dnmt3battP/attP cells during epiblast differentiation. (D) 3D-SIM nuclear mid-sections of anti-MIN (green) and anti-H3K4me3 (red) antibody distributions 30 and 60 h after induction of EpiLC differentiation combined with DAPI counterstaining (gray) in Dnmt3battP/attP cells. Lower panels represent 7× magnifications of selected boxed regions. Scale bars represent 3 μm and 500 nm in insets.
