
Figure 2.
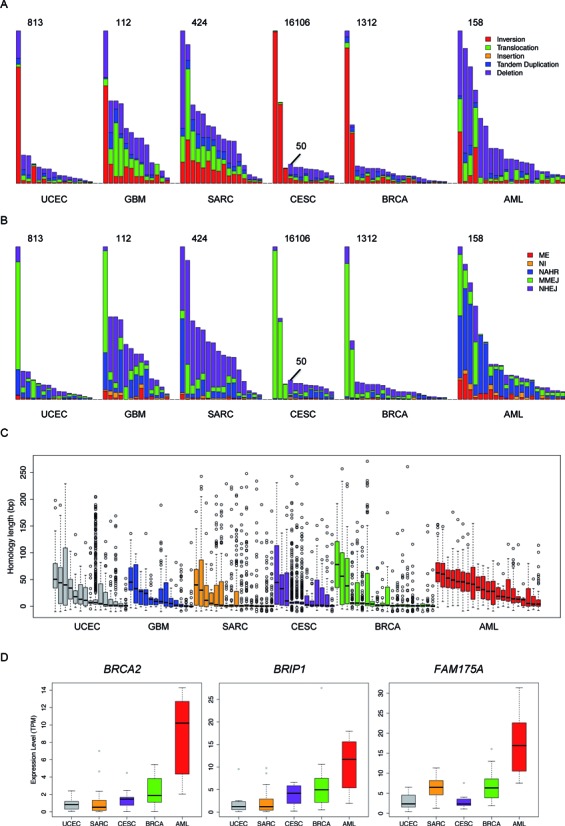
An overview of the SVs across all of the samples we analyzed. The distribution of (A) different types of SVs, (B) different breakpoint mechanisms and (C) breakpoint homology sequence lengths across all 97 samples. The evaluated cancer types are indicated at the bottom of each panel. For CESC, two different scales are used because three of the samples contain many more SVs than the remaining samples. (D) Expression levels of three key genes of the HR pathway across different cancer types. Samples within the same cancer type are ranked by the total number of somatic SVs in descending order in (A) and (B) and are ranked by the median homology sequence length in descending order in (C). TPM is transcripts per million, a means of gene expression quantification used by the RSEM algorithm, in which the total number of transcripts in a cell is normalized to one million. RNA-seq data were not available for the GBM samples.