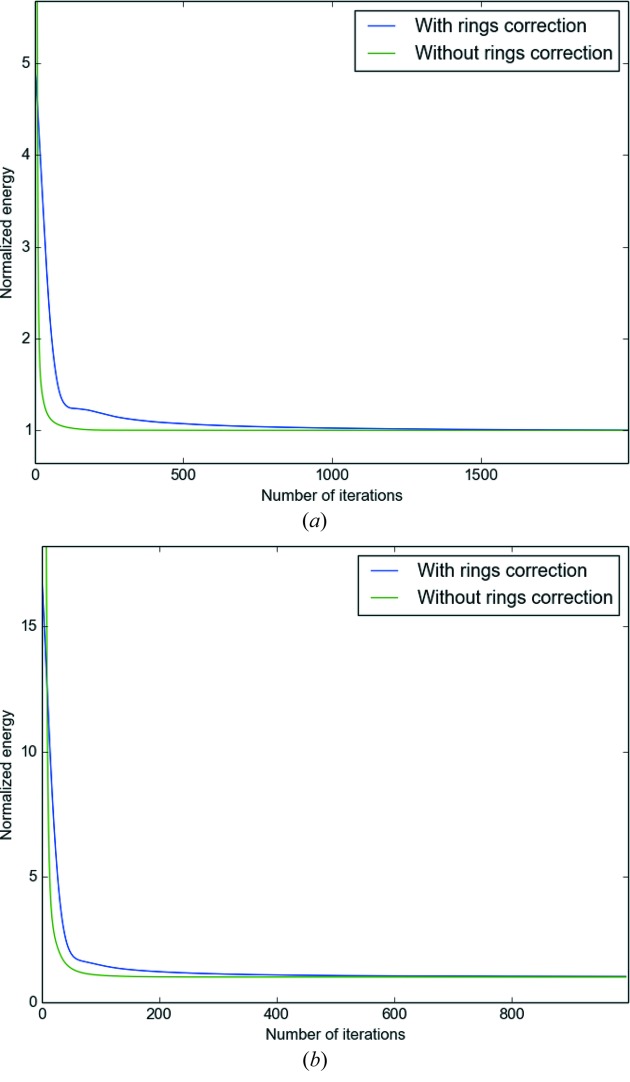
Figure 10.
Energy as a function of the number of iterations for the Total Variation tomographic reconstruction. The energy is normalized by the energy of the last iteration in order to have the same scale in the two cases. The image used is the  test image ‘Lena’ corrupted with the rings presented in the second test case. (a) Evolution of energy with 800 projections. (b) Evolution of energy with 200 projections.

