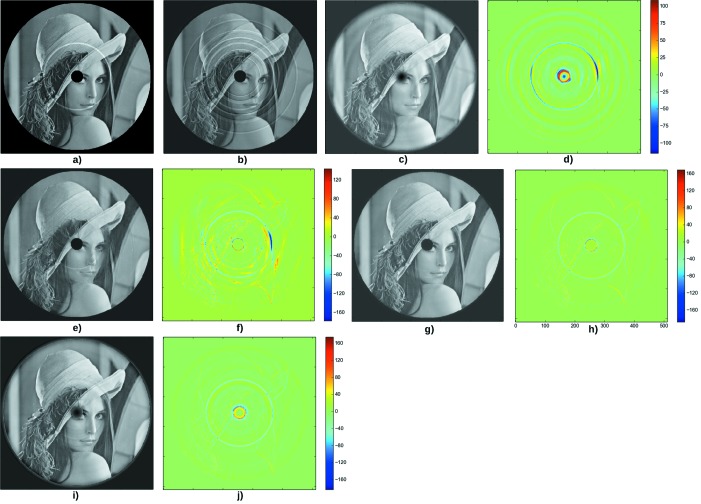
Figure 4.
Third test case. (a) Original phantom. (b) Result of filtered back-projection after adding lines of variable width and intensity in the sinogram. (c) Image back-projected after applying the Munch et al. de-striper algorithm, with  = 2.5,
  = 5 and the ‘Daubechies 20’ wavelet. (d) Difference between the phantom and the corrected image. The PSNR is 23.2. (e) Result of the correction using the RCP technique, with
  = 10 and
  = 10. (f) Difference between the phantom and the corrected image. The PSNR is 21.2. (g) Result of the reconstruction using the Total Variation regularization, with parameters
  = 0.5,
  = 0.05. (h) Difference between the phantom and the corrected image. The PSNR is 29.9. (i) Result of the reconstruction using the Dictionary Learning technique with parameters
  = 0.05,
  =
=  ,
,  = 10. (j) Difference between the reconstruction and the phantom. The PSNR is 28.3.

