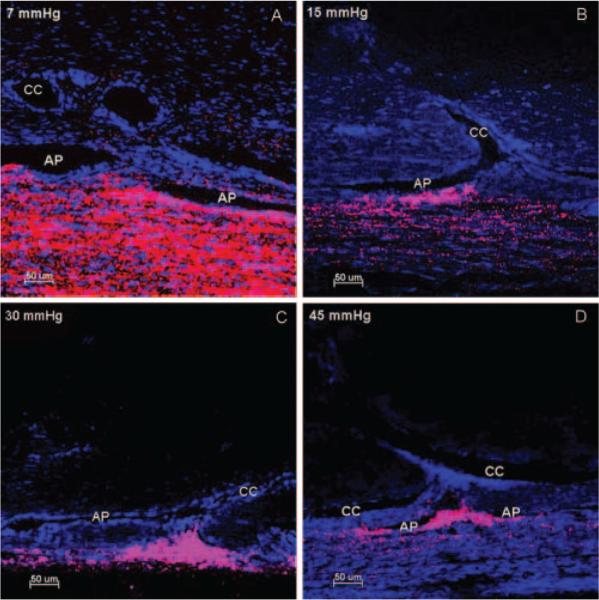
Figure 6.
Distribution of fluorescent microspheres near CC ostia at four IOPs. At 7 mm Hg (A), less segmental distribution of microspheres (red) was found along the inner wall of the AP. In contrast, at pressures of 15 mm Hg (B), 30 mm Hg (C), and 45 mm Hg (D), there was an increasing segmental pattern of microsphere distribution with a greater concentration of microspheres in the trabecular meshwork near the CC ostia. Triangular distribution of microspheres was seen when more trabecular meshwork tissue was herniated into CC ostia (C) compared with a more diffuse pattern when less trabecular mesh-work tissue (B, D) herniated into CC ostia. Collapse of AP was seen with increasing IOP. Scale bar, 50 μm.

