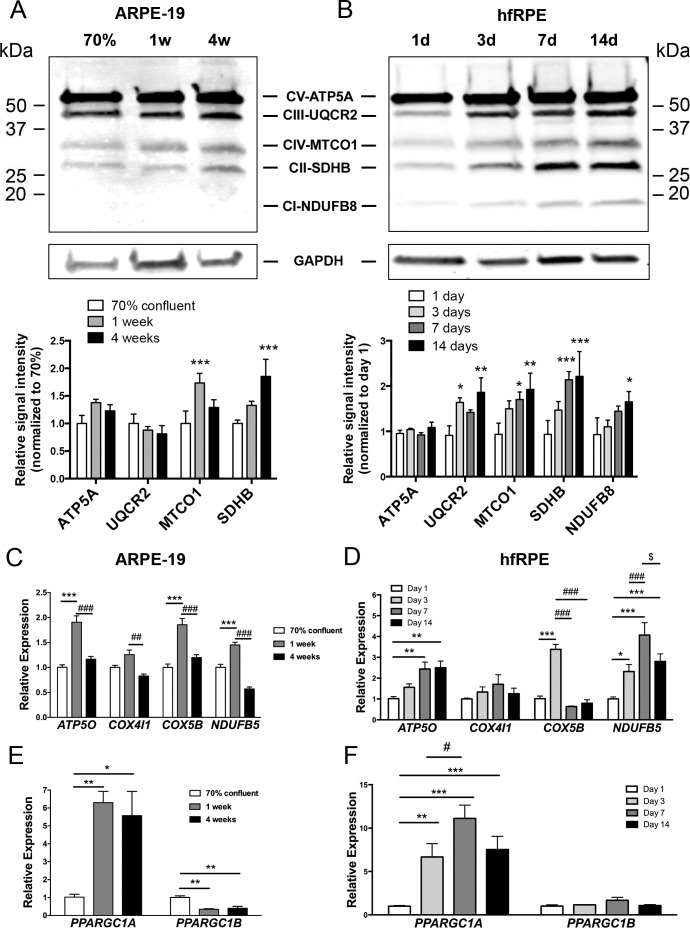
Figure 2.
Increased OXPHOS protein and gene expression during RPE maturation. Levels of OXPHOS proteins during (A) ARPE-19 maturation and (B) hfRPE maturation and normalized to glyceraldehyde-3-phosphate dehydrogenase. For (A), n = 4 per time point; *P < 0.05, **P < 0.01 vs. 70% confluent: for (B), n = 3 per time point; *P < 0.05 vs. 1 day. ANOVA followed by Dunnett's multiple comparison test. (C) Gene expression of OXPHOS components measured by qPCR during ARPE-19 maturation and (D) hfRPE maturation. For (C), n = 3 per time point; ***P < 0.001 vs. 70% confluent; ##P < 0.01, ###P < 0.001 vs. 4 week confluent. ANOVA followed by Tukey's multiple comparison test. For (D), n = 3 per time point; *P < 0.05; **P < 0.01; ***P < 0.001 vs. day 1; ###P < 0.001 day 3 vs. day 7 or day 14; $P < 0.05 day 7 vs. 14. ANOVA followed by Tukey's multiple comparison test). (E, F) Gene expression of PGC-1α (PPARGC1A) and PGC-1β (PPARGC1B) measured by qPCR during (E) ARPE-19 maturation or (F) hfRPE maturation. Expression for (E), n = 3 for each time point; *P < 0.05, **P < 0.01 vs. 70% confluent. For (F), n = 3 for each time point; **P < 0.01, ***P < 0.001 versus day 1; #P < 0.05 day 3 vs. day 7. Data were analyzed by ANOVA followed by Tukey's multiple comparison test.

