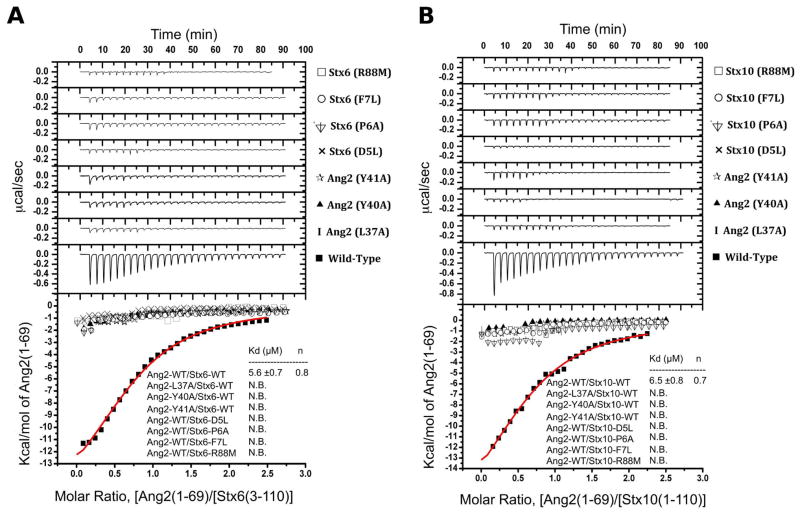
Figure 4.
Isothermal titration calorimetry of Ang2 interactions with Stx6 and Stx10. The top graphs represent the differential heat released during the titration of (A) Stx6 Habc with Ang2 (1-69) or (B) Stx10 Habc with Ang2 (1-69). The bottom graphs represent the fitted binding isotherms. All mutants within the conserved L37xxYY41 motif of Ang2 and the D5PF[…]R88 motif of Stx6 or Stx10 are annotated on the side of their respective titration curve. The Kd and binding stoichiometries (n values) are indicated as insets (N.B., no appreciable binding).

