
Figure 4.
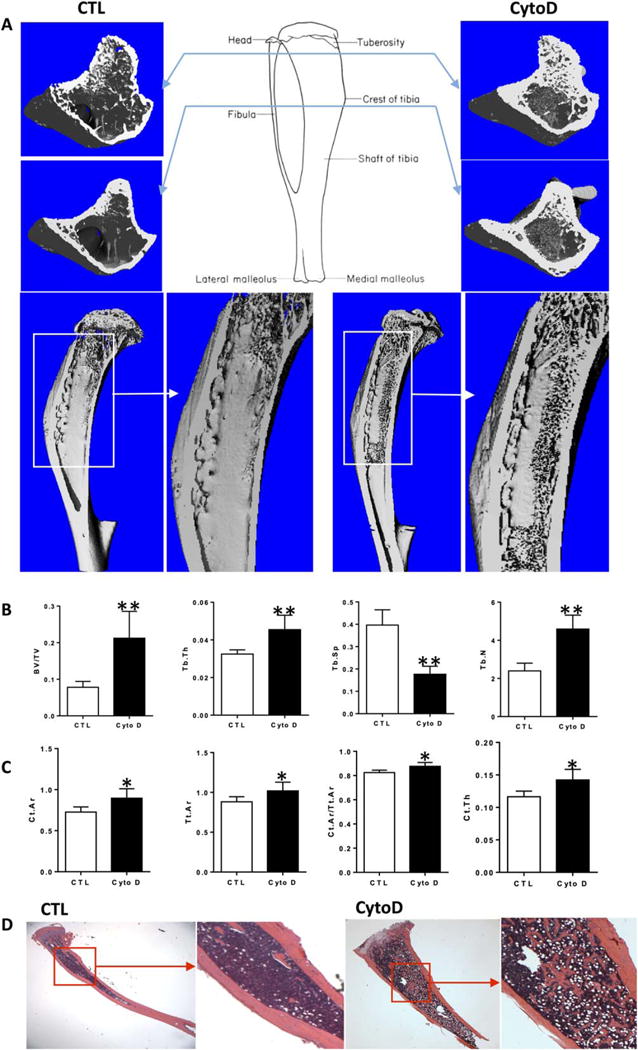
Bone formation is induced by intra-tibial injection of cytochalasin D. (A): 3D images of cross and vertical sections of right tibia reconstructed from μCT. (B, C): Trabecular and cortical quantitative measurement for the same tibia as (A). (D): H&E staining for the right tibia with/without CytoD treatment. Asterisks indicate significant difference, *, p< 0.05; **, p < 0.01. Abbreviations: CTL, control; CytoD, cytochalasin D.