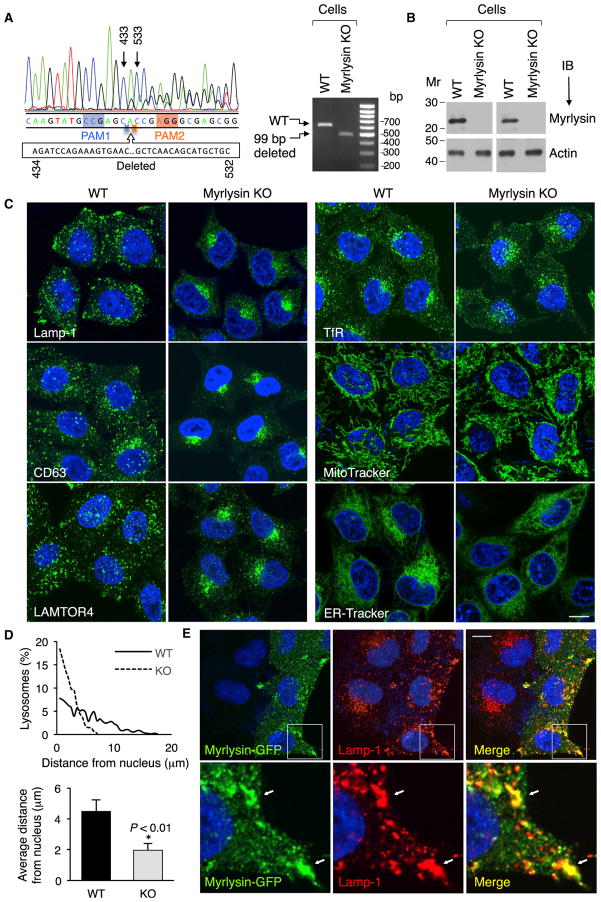
Figure 3. Myrlysin Regulates Lysosome Positioning.
(A) Sanger sequencing of the genomic PCR product from a CRISPR/Cas9 myrlysin-KO HeLa cell clone shows a 99-bp deletion (residues 434–532 of cDNA) between two protospacer-adjacent motifs (PAM) (left). The agarose gel shows the PCR products from WT and myrlysin-KO cells (right).
(B) No myrlysin was detected in the KO cells by immunoblotting using antibodies to a synthetic peptide (residues 167–196) (left two lanes) or to a GST fusion protein (right two lanes).
(C) Confocal microscopy of WT and myrlysin-KO cells immunostained for Lamp-1, CD63, LAMTOR4, or TfR or stained with MitoTracker or ER-Tracker. Scale bar, 10 μm.
(D) The distance of lysosomes from the nucleus boundary in WT (solid line and black bar) and myrlysin-KO cells (dashed line and gray bar) was measured using ImageJ. Twenty-five cells in each group were analyzed. Bar graphs represent the mean ± SD. The p value was calculated using Student’s t test.
(E) myrlysin-GFP was transiently expressed in myrlysin-KO cells, and lysosomes were visualized by immunostaining with antibody to Lamp-1. Scale Bar, 10 μm. Notice the rescue of the lysosome-positioning phenotype in the myrlysin-GFP transfected but not in the untransfected cells. The bottom row shows 3.9-fold-magnified views of the insets. Arrows indicate co-localization. See also Figure S2.

