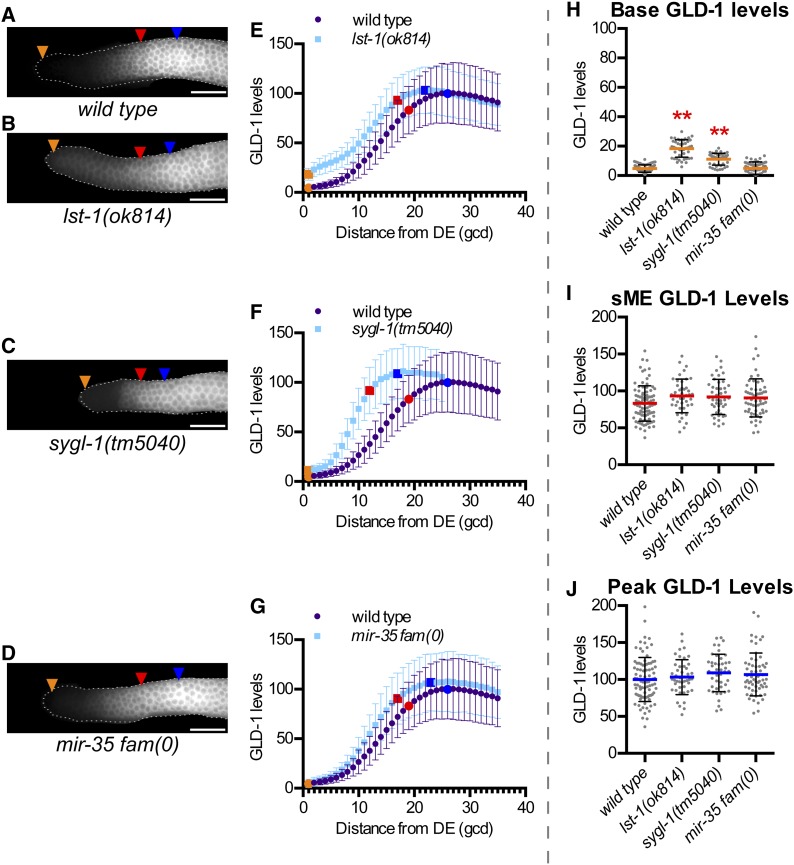
Figure 5.
lst-1 and sygl-1, but not mir-35 family, are required for low GLD-1 base levels. (A–D) Representative GLD-1 immunofluorescence images for the indicated genotypes. mir-35 fam(0) corresponds to mir-35 through 41(nDf50) mir-42-45(nDf49). Orange triangles, 1st gcd; red triangles, sME; blue triangles, eME; and white bars are 25 µm. (E–G) Plots of GLD-1 levels. DE, distal end. Error bars ± SD. Orange dot, base; red dot, sME; blue dot, peak. Scatterplots are of (H) base, (I) sME, and (J) peak. **P ≤ 0.01, Fisher’s LSD, in red, mean is higher compared to wild type.

