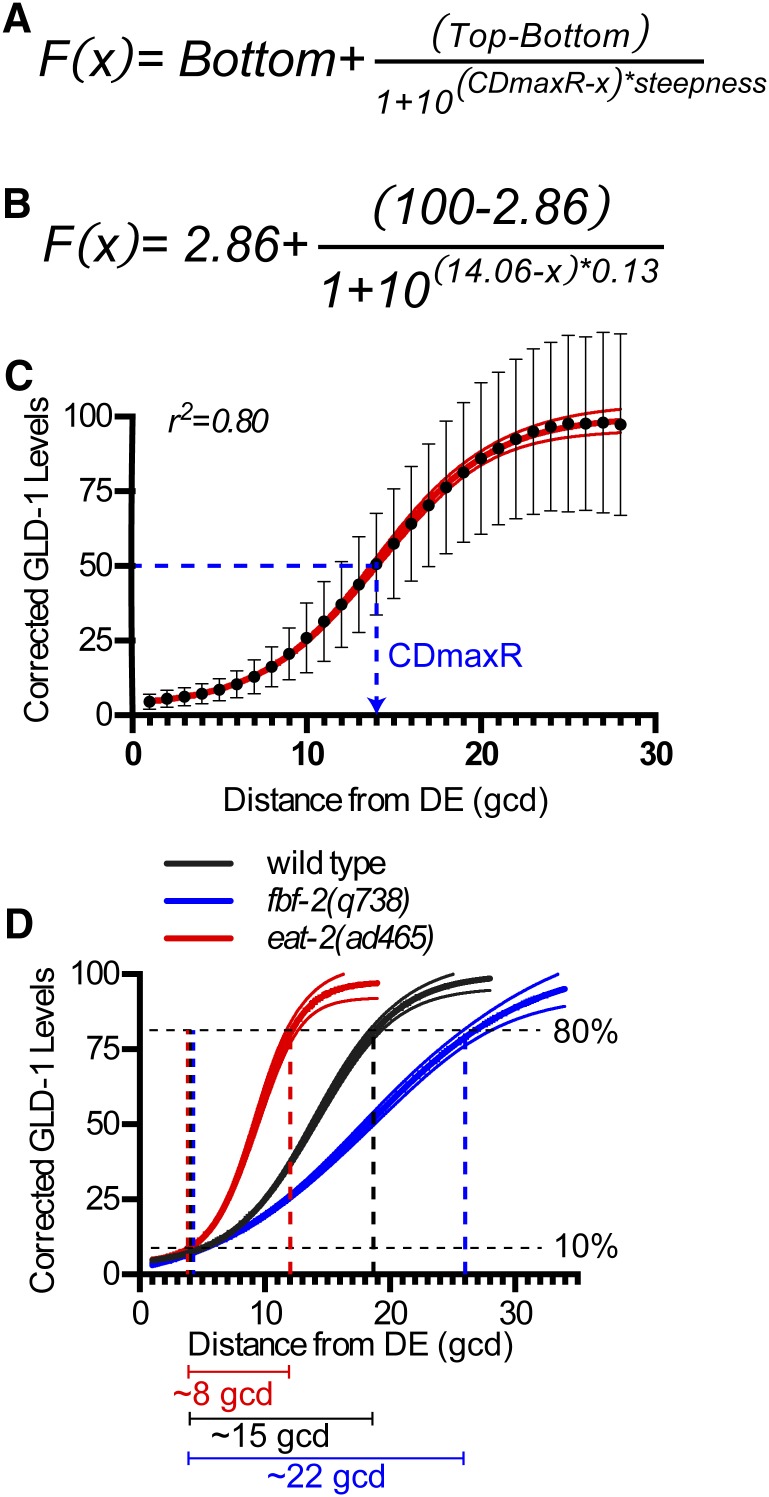
Figure 7.
Sigmoidal modeling of GLD-1 accumulation pattern. (A) Modified four-parameter dose–response equation. Bottom and top are not representative of base and peak, but rather theoretical asymptotes used in defining the model. CDmaxR, cell diameter where the ratio of GLD-1 synthesis/GLD-1 turnover is maximum and GLD-1 levels is halfway between top and bottom. (B) Best-fit model equation for wild type. (C) Plot comparing wild-type GLD-1 levels vs. best-fit model. Black dots, mean corrected GLD-1 levels. Red solid line, best-fit model from B. Red dashed lines, 99% confidence interval of best-fit model. r2 = 0.80, weighted correlation. Blue dashed line marks the position of CDmaxR in wild type at ∼14 gcd. (D) Plot comparing best fit-models of genotypes shown, which have the same base and peak but different steepness. Lines are best-fit model ± 99% confidence interval. Bars below graph are span, in gcd, for GLD-1 levels to elevate from 10 to 80% in eat-2 (red), wild type (black), and fbf-2 (blue).

