Figure 1.
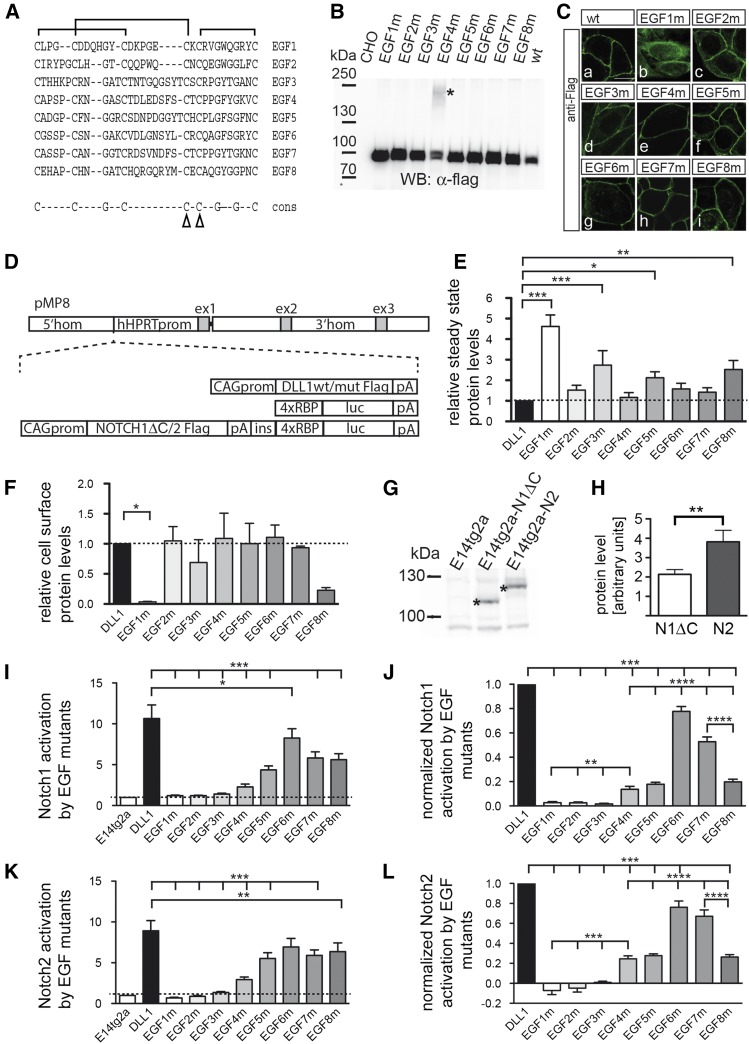
Analyses of EGF repeat mutant DLL1 proteins in cultured cells in vitro. (A) Alignment of amino acid sequences of DLL1 EGF repeats. The characteristic disulfide bridges are indicated by brackets above the sequence; arrowheads in the consensus sequence point to the mutated cysteine residues. (B) Western blot analysis of cell lysates of CHO cells transfected with expression vectors for DLL1 proteins as indicated at the top. CHO cells expressed all mutant proteins at the expected molecular weight. In the case of EGF4m, an additional slower-migrating protein species was observed (asterisk). This high-molecular-weight species was not shifted to a lower molecular weight by treatment with reducing agents (DTT and iodoacetamide) and thus is unlikely to be caused by aberrant disulfide bridges. When the extracellular domain of EGF4m was expressed as a soluble Fc fusion, only a protein of the expected size was observed (data not shown), suggesting that the intracellular domain or localization at the cell membrane leads to an as-yet-unknown modification of some EGF4m protein. For quantification, both protein species were taken into account. (C) Detection of DLL1 proteins in CHO cells by immunofluorescence. All DLL1 variants except EGF1m are at the cell surface. (D) Schematic representation of constructs used to generate single-copy transgene insertions in the Hprt locus. (E) Quantification of DLL1 proteins in E14tg2a ES cells expressing DLL1 variants from the Hprt locus (mean values and SEM; n = 4; Table S1). (F) Quantification of relative cell-surface levels of DLL1 variants normalized to DLL1 wild type (mean values and SEM; n = 4; Table S2). (G) Western blot analysis of cell lysates of E14tg2a H-RBPluc ES cells expressing NOTCH1ΔC-Flag from a random insertion (E14tg2a-N1) and NOTCH2-Flag from the Hprt locus (E14tg2a-N2). Asterisks indicate the S1 cleavage products of NOTCH1ΔC and NOTCH2. (H) Quantification of NOTCH1ΔC-Flag and NOTCH2-Flag stably expressed in E14tg2a H-RBPluc ES cells (mean values and SEM; n = 7; Table S3). (I) Activation of NOTCH1ΔC by DLL1 variants in coculture assays (mean values and SEM; n = 10; Table S4). (J) Normalized activation of NOTCH1ΔC by DLL1 variants in coculture assays. Values of EGF3m, -5m, and -8m were normalized to protein expression levels relative to DLL1 wild type (Table S5). (K) Activation of NOTCH2 by DLL1 variants in coculture assays (mean values and SEM; n = 9; Table S4). (L) Normalized activation of NOTCH2 by DLL1 variants in coculture assays. Values of EGF3m, -5m, and -8m were normalized to protein expression levels relative to DLL1 wild type (Table S5). ns = P > 0.05; *P < 0.05; **P < 0.01; ***P < 0.001; ****P < 0.0001

