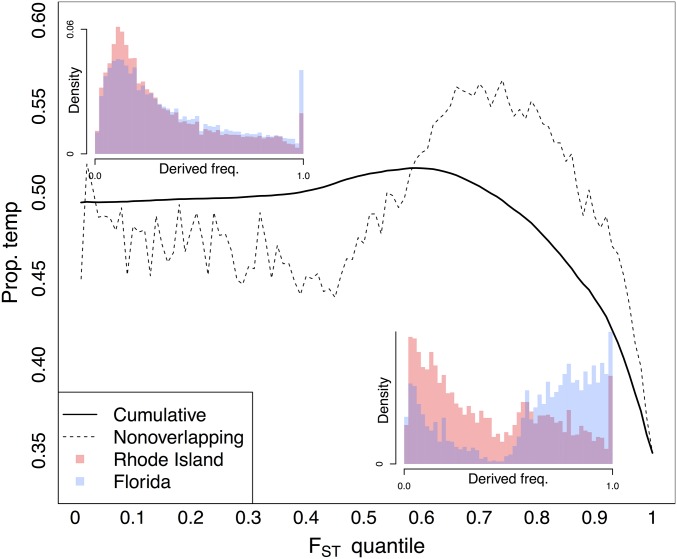
Figure 3.
Proportion of derived alleles that are at higher frequency in higher-latitude populations as a function of in North America. Dotted line represents the proportion in nonoverlapping bins. Solid line represents the cumulative distribution of the dotted line. Left inset is the derived allele-frequency spectra for the two North American populations. Right inset is the genome-wide derived allele-frequency spectra for SNPs in the 0.99 tail. Only SNPs segregating at a total frequency > 0.05 in North America were considered.

