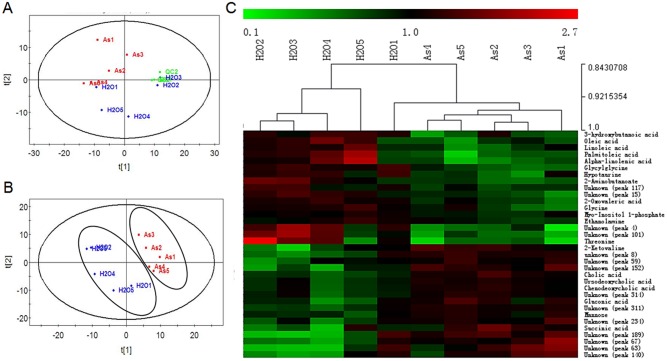
Fig 1. Results of chemometric analysis and hierarchical clustering.
(A) PCA plot showing tight clustering of QC samples and inherent separation between control and treated groups. (B) PLS-DA plot with decent separation of the two groups. (C) Hierarchical clustering of samples using peak areas of the 34 potential metabolite markers. Peak areas were quantile-normalized and standardized to respective mean value of each metabolite among all samples. Hierarchical clustering was performed using Pearson correlation method without mean centering.

