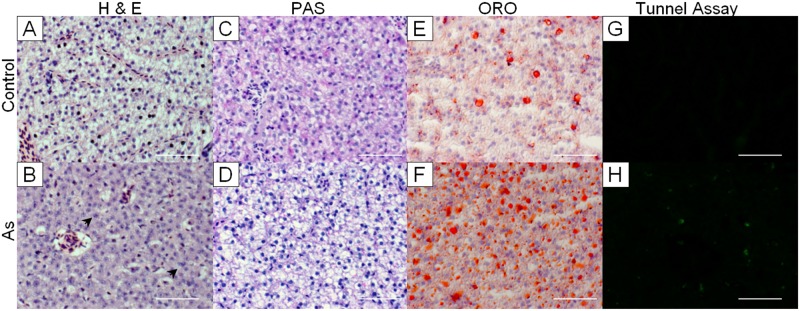
Fig 3. Histological examinations of liver sections.
(A-B) H&E staining revealed changes in cellular organization, cytoplasmic volume, and nuclei morphology in treated group (lower panel) as compared to control (upper panel). (C-D) ORO staining showed marked accumulation of lipid dropolets in As group. (E-F) Glycogen depletion in the As group was evident with PAS staining. (G-H) Increased apoptotic cells (stained with green fluorescence) were observed in the As group. Magnification: 400x. Arrow: binucleated cells. Scale bars: 50μm.

