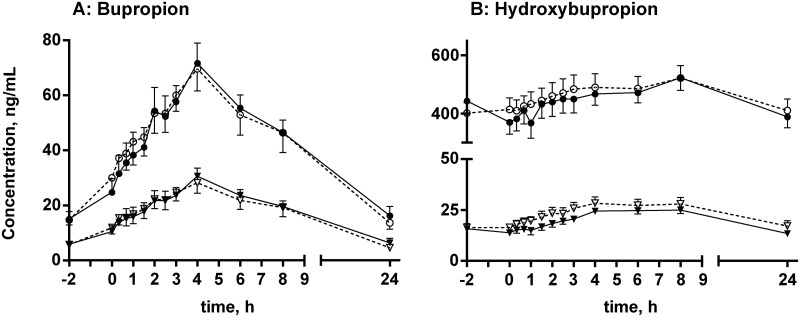
Fig 7. Chiral plasma-concentration time profiles for bupropion and hydroxybupropion.
Plasma-concentration time profiles for R- and S-bupropion (A) and R,R- and S,S-hydroxybupropion (B) after co-administration of placebo (black) or MDMA (white). Circles represent R- and R,R-stereoisomers. Triangles represent S- and S,S-stereoisomers. The data are expressed as mean and SEM (n = 16 participants). Differences between placebo and MDMA were not statistically significant.

