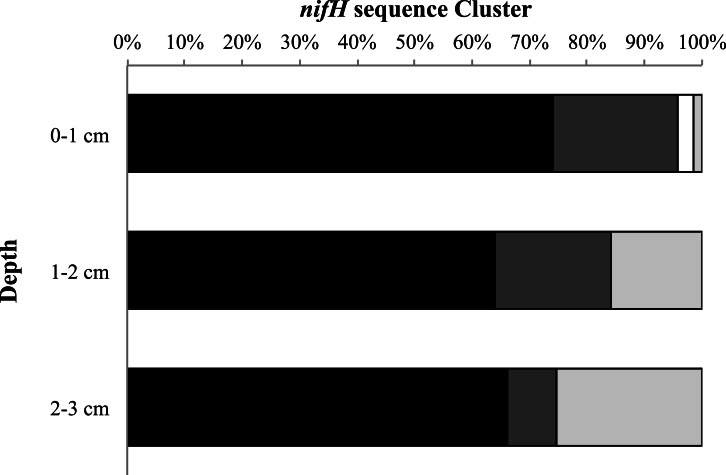
Figure 5. nifH cluster identity with depth.
Cluster identity with depth for Metoxit Point, South Basin, and Sage Lot Pond for August 2011 (the month with the best sequence coverage at each depth). Dark gray represents Cluster I, light gray represents Cluster II, black represents Cluster III, and white represents unknown, uncultured matches. Cluster identifications were based on closest BLAST matches from the NCBI database.

