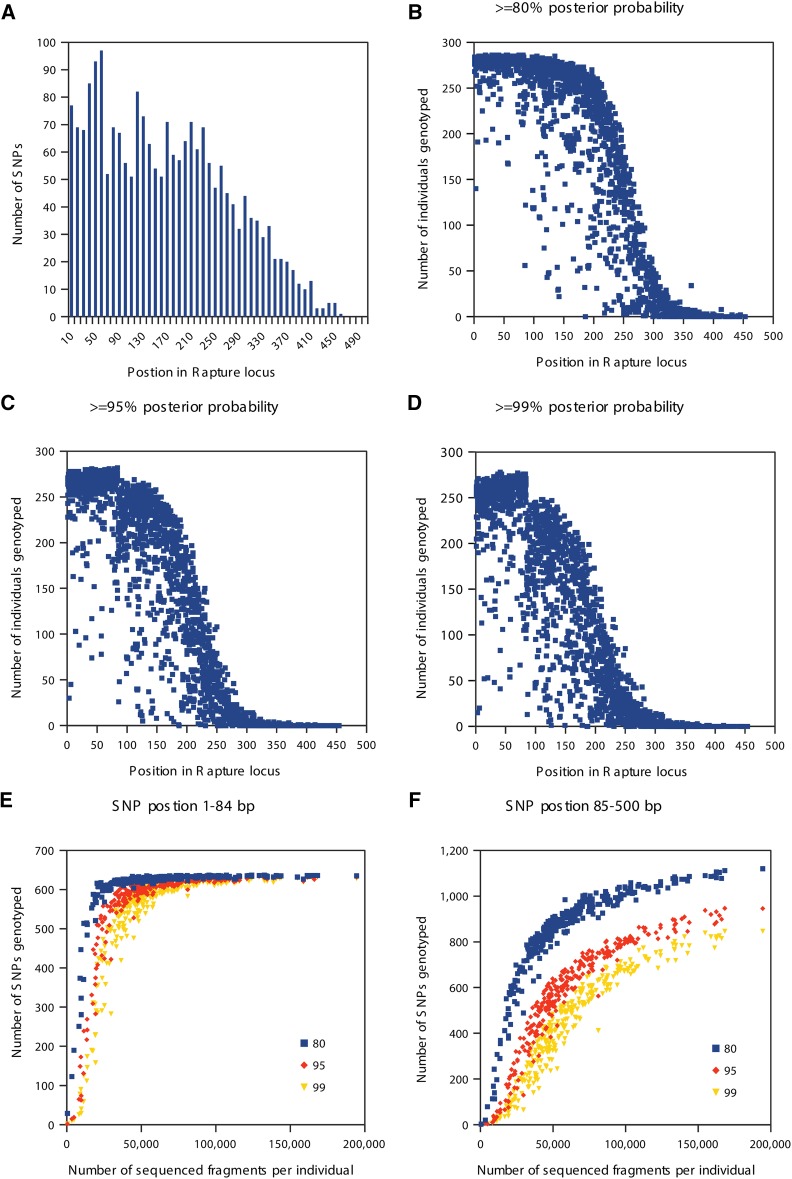
Figure 4.
SNP discovery using Rapture with one-fifth bait concentration data. (A) Histogram showing the number of SNPs per bin of position in Rapture locus. (B–D) Scatter plots showing the relationship between the number of individuals genotyped and SNP position using different posterior probability cutoffs. (E) Scatter plot showing the relationship between the number of SNPs genotyped and the number of sequenced fragments per individual for SNPs in position 1–84. (F) Scatter plot showing the relationship between the number of SNPs genotyped and number of sequenced fragments per individual for SNPs in position 85–500.

