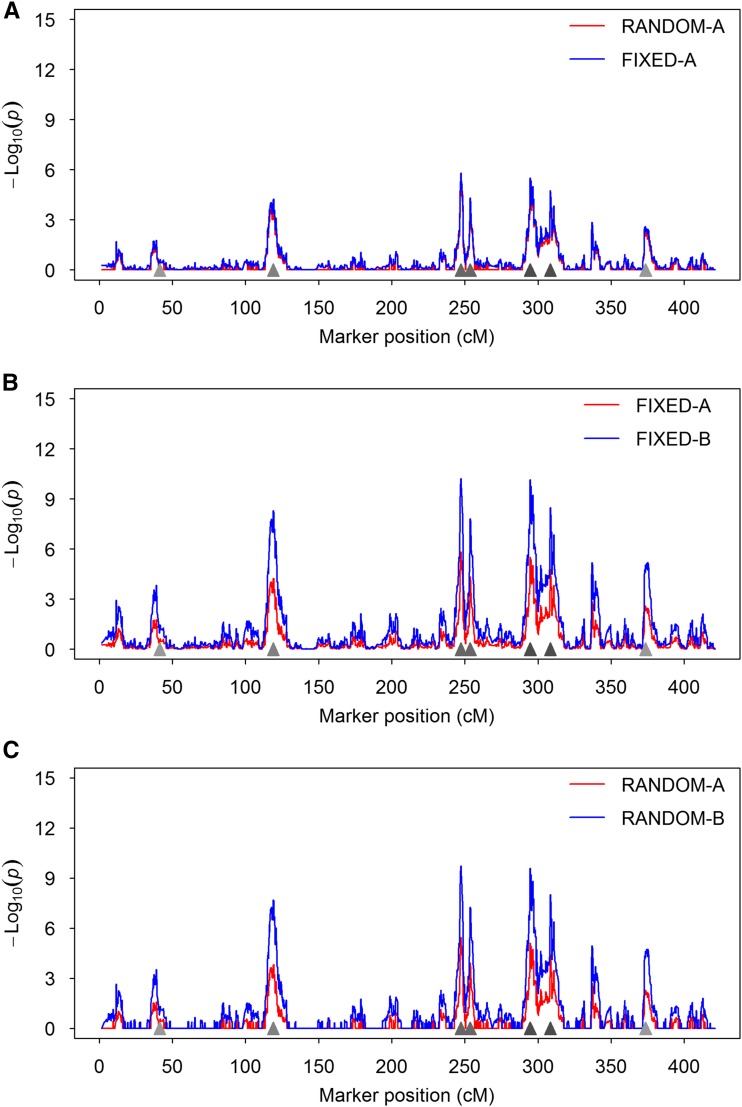
Figure 1.
Test-statistic profiles of different methods from a simulated data set. The test statistics are presented as . Locations of the simulated QTL are represented by the filled triangles on the x-axis. This figure demonstrates the common behaviors of the different methods that are expected in a real data analysis. (A) Comparison between RANDOM-A and FIXED-A. (B) Comparison between FIXED-A and FIXED-B. (C) Comparison between RANDOM-A and RANDOM-B.

