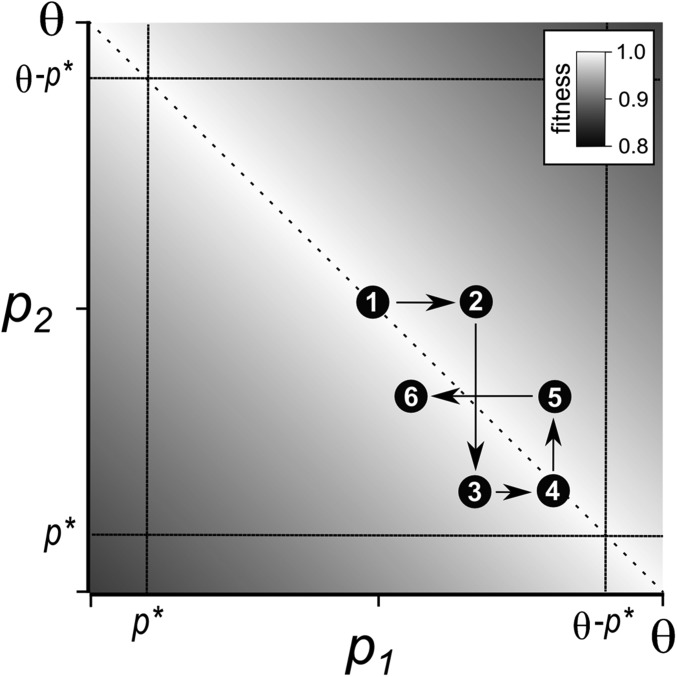
Figure 2.
Schematic of the coevolution of paralog expression under compensatory drift. Axes show the expression of the duplicate genes, and fitness is represented with a gray scale. The dashed diagonal line shows the maximal fitness where p1 + p2 = θ. The dotted vertical and horizontal lines show the expression thresholds where a duplicate loses its original function. A sequence of several consecutive expression changes is shown with numbered circles.

