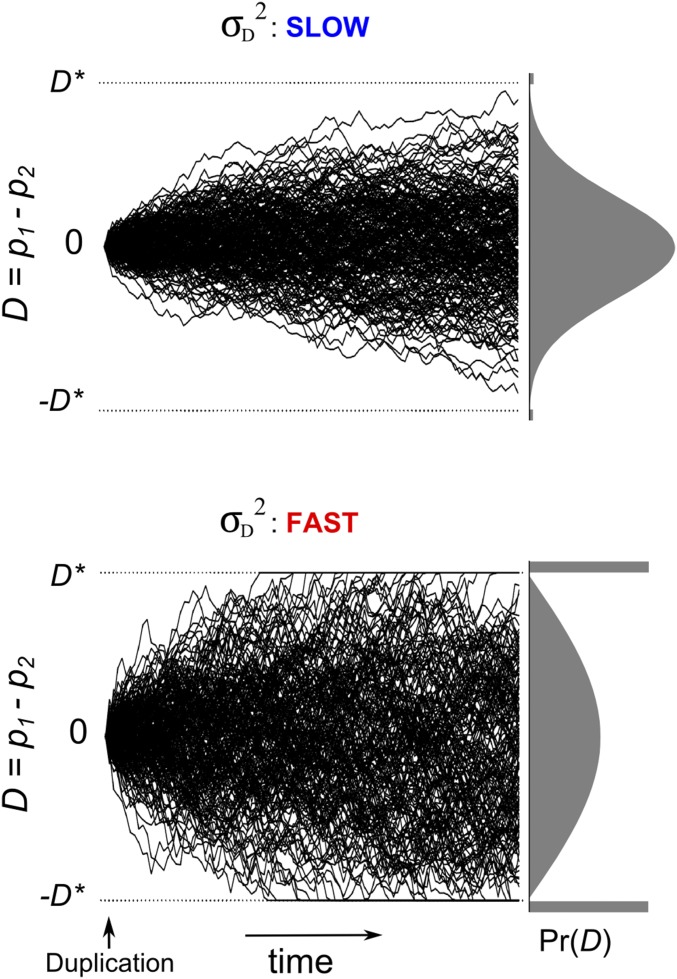
Figure 3.
The speed of divergence in the expression of duplicate genes. Examples of the evolution of expression difference D (= p1 − p2) when the diffusion parameter is small (top) and large (bottom). Each panel shows sample trajectories and the final probability distribution for D (at right). In the top panel, the final distribution of D is approximately normal; neofunctionalization and pseudogenization are rare. In the bottom panel, neofunctionalization is frequent (large rectangles outside the thresholds at ±D*).

