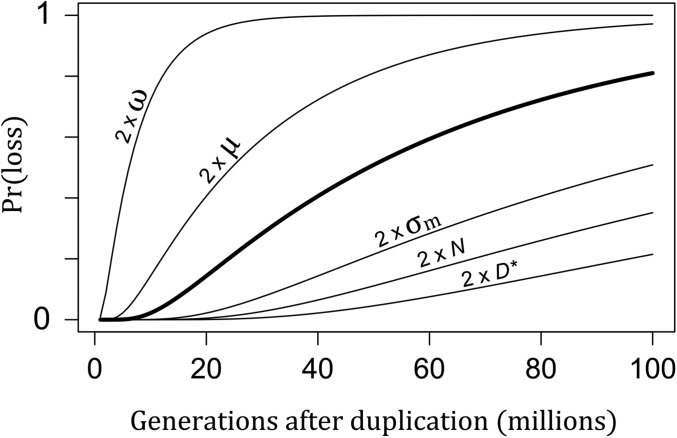
Figure 4.
The probability of gene loss after duplication. The thick curve shows the probability of loss, either through pseudogenization or neofunctionalization, over time with standard parameter values: the selection strength is ω2 = 104, the SD of the mutation effect size is σm = 1, the population size is N = 104, the mutation rate is μ = 10−5, and the expression threshold is D* = 100. Other curves show results when individual parameter values are doubled.

